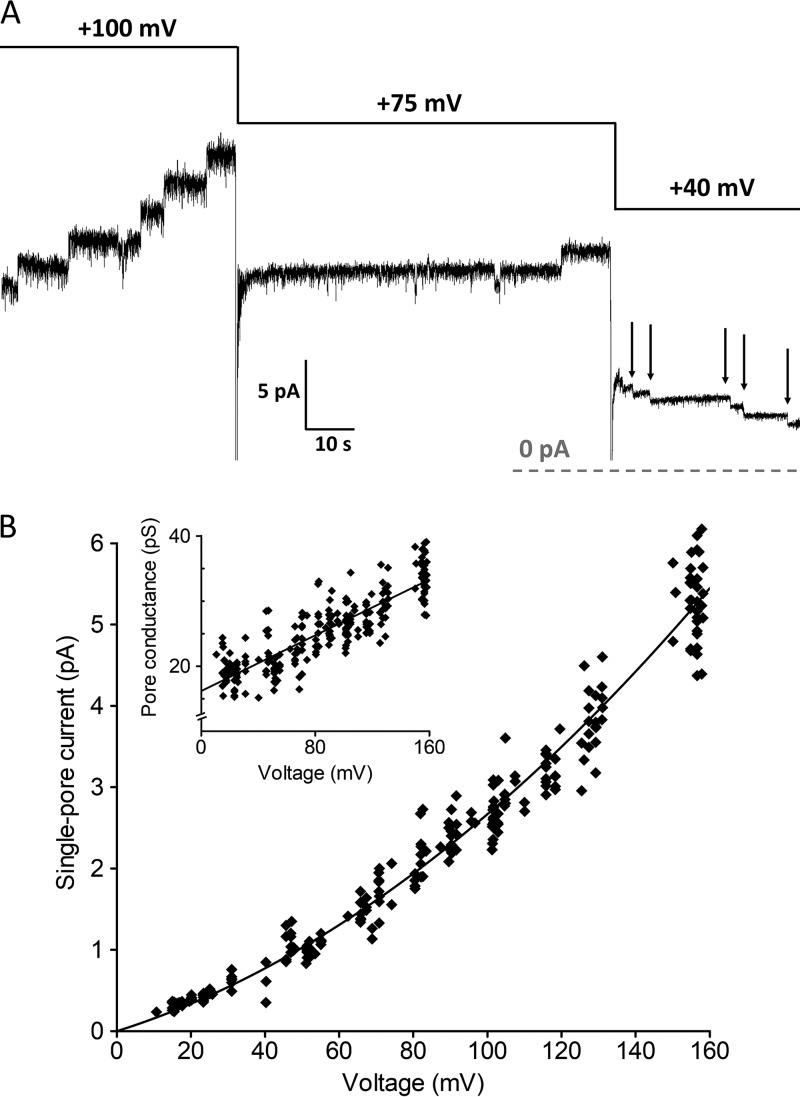
FIG 6.
(A) Representative current recording of colicin U measured with different membrane potentials. The pores which opened at 100 mV were closed later when the membrane potential was lower than 40 mV (arrows). The dashed line indicates zero current. (B) Dependence of single-pore current on applied membrane potential (fitted to the polynomial function y = 16x + 0.11x2). The inset shows the same data expressed as the single-pore conductance with the corresponding linear fit y = 16 + 0.11x. Every point represents one opening or closing of a pore (n = 270). Measured in a solution of 1 M KCl and 10 mM HEPES at pH 6.

