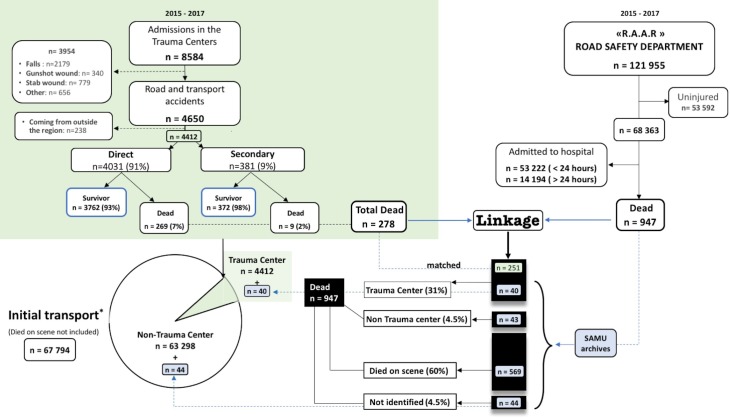
Fig 2. Flow charts of the study.
Green filling: Traumabase data. Black boxes: RAAR and Traumabase linkage to identifiy the place of death of patients dead outside the trauma centre. Blue filling: Data extracted from SAMU archives. Pie: Population of hospital admissions extracted from RAAR, Traumabase and SAMU archives joint analysis

