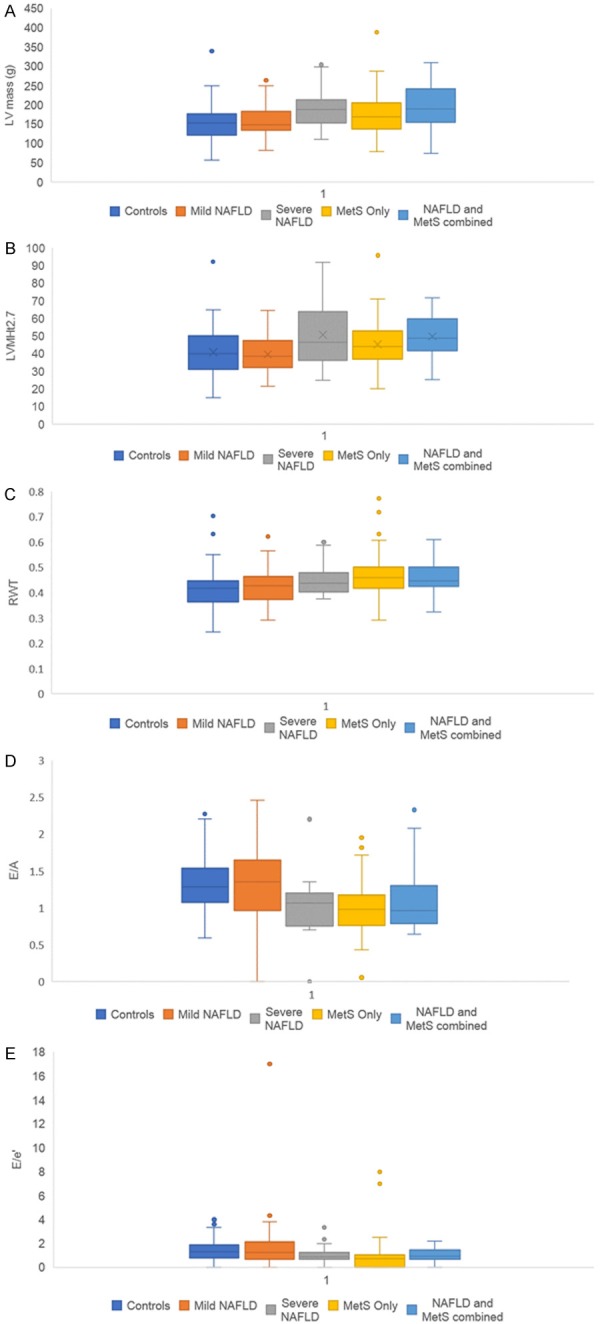
Figure 2.

A. Box and whisker plots of mean left ventricular (LV) mass comparison across liver disease status for mild and severe NAFLD, MetS, NAFLD and MetS combined in comparison with control group. B. Box and whisker plots of left ventricular mass after normalization for height2.7 (LVMHt2.7) comparison across liver disease status for mild and severe NAFLD, MetS, NAFLD and MetS combined in comparison with control group. C. Box and whisker plots of relative wall thickness (RWT) comparison across liver disease status for mild and severe NAFLD, MetS, NAFLD and MetS combined in comparison with control group. D. Box and whisker plots of ratio between peak early (E) and late (A) diastolic ventricular filling velocities (E/A) comparison across liver disease status for mild and severe NAFLD, MetS, NAFLD and MetS combined in comparison with control group. E. Box and whisker plots of ratio between early mitral inflow velocity (E) and mitral annular early diastolic velocity (e’) (E/e’) comparison across liver disease status for mild and severe NAFLD, MetS, NAFLD and MetS combined in comparison with control group.
