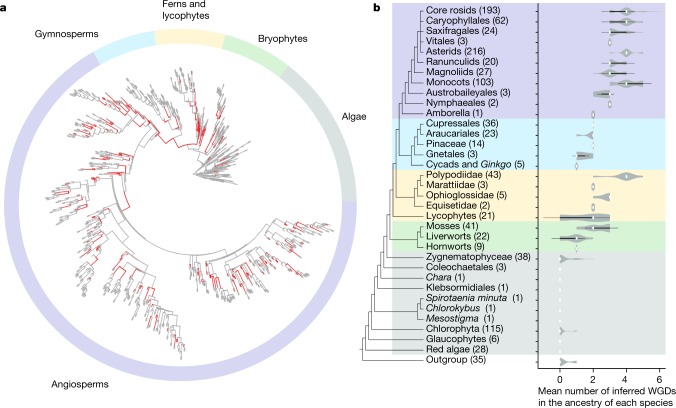
Fig. 4. The distribution of inferred ancient WGDs across lineages of green plants.
a, The locations of estimated WGDs are labelled red in the phylogeny of all 1000 Plants (1KP) samples. b, The number of inferred ancient polyploidization events within each lineage is shown in the violin plots. The white dot indicates the median, the thick black bars represent the interquartile range, the thin black lines define the 95% confidence interval and the grey shading represents the density of data points. The sample sizes for each lineage are shown within parentheses along with taxon names on the phylogeny. The phylogenetic placement of inferred WGDs is illustrated in Supplementary Fig. 8 and data supporting each WGD inference are provided in Supplementary Table 2.

