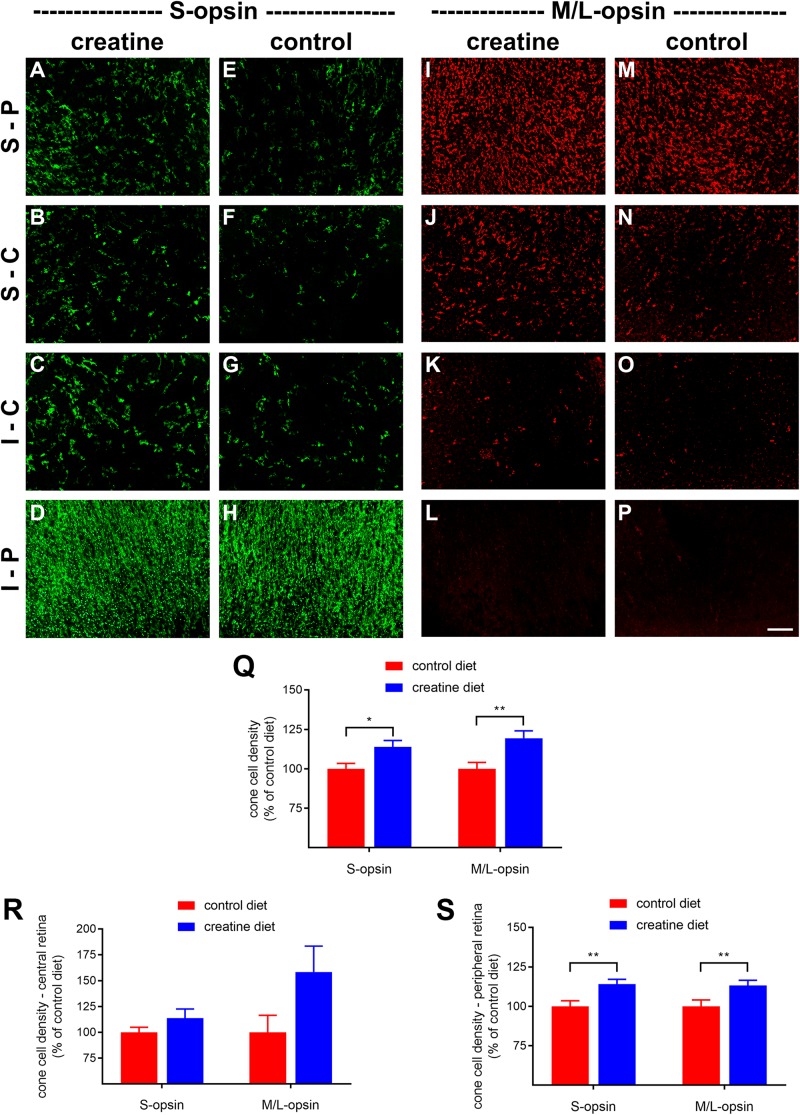
FIGURE 12.
Effect of creatine supplementation on cone survival. (A–P) Photomicrographs of wholemount Rd1 retinas analyzed at postnatal day (P) 60 immunolabeled for S-opsin and M/L-opsin. Representative images from mice fed a creatine-enriched diet (A–D,I–L) or a normal diet (E–H,M–P) are shown. S-P, superior-peripheral retina; S-C, superior-central retina; I-C, inferior-central retina; I-P, inferior-peripheral retina. Scale bar 100 μm. (Q–S) Quantification of S-opsin-labeled cones and M/L-opsin-labeled cones in retinal wholemounts from Rd1 mice fed a creatine-enriched diet or a standard diet. Data are shown for the whole retina (Q), subdivided into central (R), and peripheral (S) regions. Values, shown as % of control diet, represent mean ± SEM, where n = 18–21. ∗P < 0.05, ∗∗P < 0.01 by Student’s unpaired t-test (creatine vs. control eyes).

