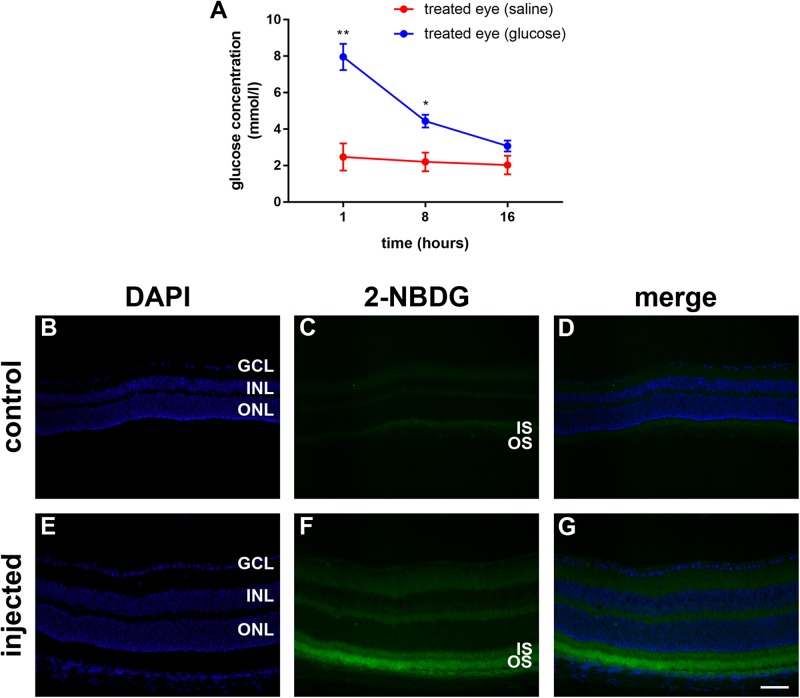
FIGURE 2.
(A) Quantification of the vitreous glucose concentration in C57BL/6J mice at 1 to 16 h after subconjunctival injection of either glucose or saline. Values represent mean ± SEM, where n = 3. ∗∗P < 0.01, ∗P < 0.05 by Student’s paired t-test with Holm-Bonferroni correction. (B–G) 2-NBDG accumulation in C57BL/6J mice retinas 20 min after subconjunctival injection. In the control mouse, minimal fluorescence is observed (B–D). In the 2-NBDG injected eye, fluorescent glucose accumulates in photoreceptor segments and, to a lesser extent, in both plexiform layers (E–G). Scale bar: 50 μm. GCL, ganglion cell layer; INL, inner nuclear layer; IS, inner segments; ONL, outer nuclear layer; and OS, outer segments.

