Fig. 1.

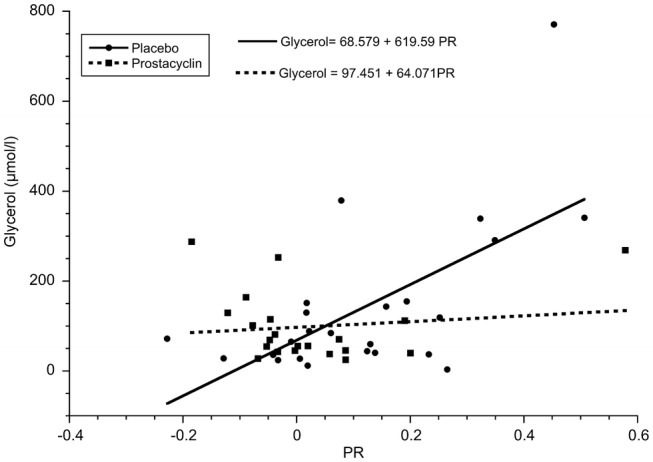
The association between glycerolmean and PR levels in the placebo (n = 24, ρ = 0.503, p = 0.012, Spearman’s Rho) and prostacyclin groups (n = 21, ρ = − 0.323, p = 0.153, Spearman’s Rho). The lines are the linear fit in the two groups

The association between glycerolmean and PR levels in the placebo (n = 24, ρ = 0.503, p = 0.012, Spearman’s Rho) and prostacyclin groups (n = 21, ρ = − 0.323, p = 0.153, Spearman’s Rho). The lines are the linear fit in the two groups