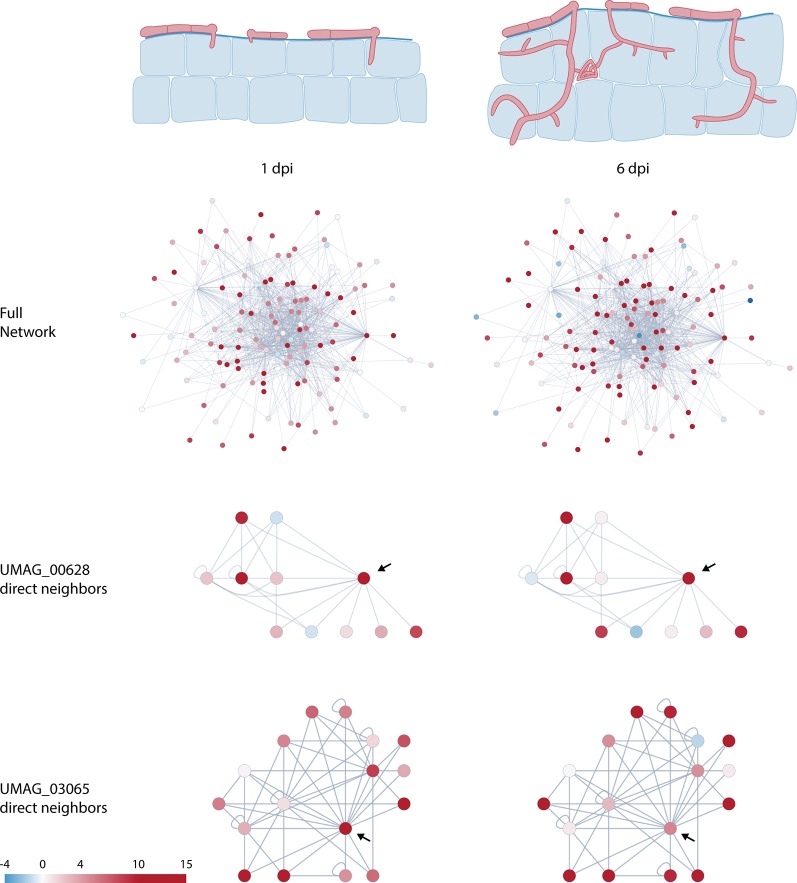
Figure 2.
Schematic representation of U. maydis infection at 1 and 6 days post infection (dpi) and changes in predicted protein–protein interaction network dynamics of putative effectors. Nodes are colored according to Log2 fold change relative to axenic culture (Lanver et al., 2018). Arrows in the subnetworks indicate network centers.

