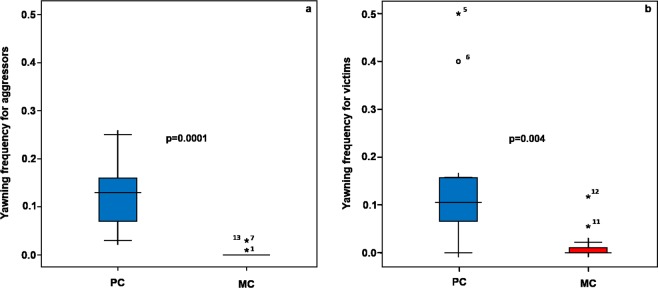
Figure 3.
Yawning hourly frequency in the 30-sec time interval in Post-conflict (PC) and Matched-Control (MC) observations for aggressors (a) and victims (b). The box plots show the median and 25th and 75th percentiles; the whiskers indicate the values within 1.5 times the inter-quartile range, IQR. The open dot indicates an outlier more than 1.5 IQR from the rest of the scores. Asterisks indicate outliers more than 3.0 IQR from the rest of the scores.

