
Figure 2.
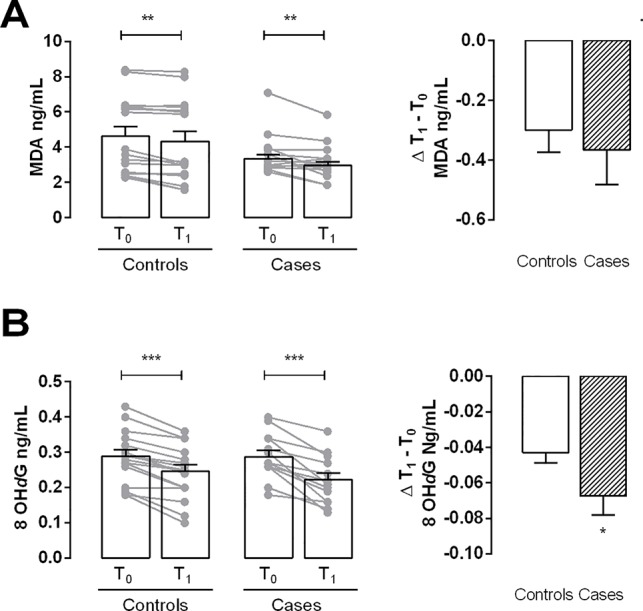
Evaluation of oxidative stress markers. (A) Bar graph shows the levels of malonyldialdehyde (MDA) in controls and cases at T0 and T1. (B) Bar graph shows the levels of 8-hydroxy-deoxyguanosine (8-OHdG) in controls and cases at T0 and T1. Delta (Δ) values are calculated by subtracting the final value at 3 months from the corresponding initial value at baseline. Values are mean ± S.E.M. for n = 18 subjects/group. *p < 0.05 vs control,**p < 0.01 vs T0; ***p < 0.001 vs T0. Two-way ANOVA followed by Bonferroni’s post-hoc test was used for the analysis of differences among the groups; t-test was used for the variation analysis (Δ T1 − T0).