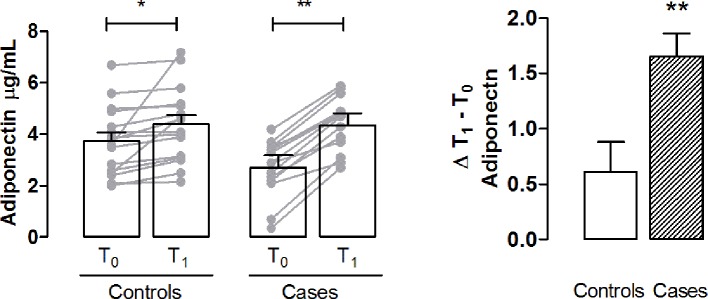
Figure 4.
Determination of plasma adiponectin as a marker of metabolic dysregulation. Bar graph shows the plasma levels of adiponectin in controls and cases T0 and T1. Delta (Δ) values are calculated by subtracting the final value at 3 months from the corresponding initial value at baseline. Values are mean ± S.E.M. for n = 18 subjects/group. *p < 0.05, **p < 0.01 vs T0 and vs control. Two-way ANOVA followed by Bonferroni’s post-hoc test was used for the analysis of differences among the groups; t-test was used for the variation analysis (Δ T1 − T0).

