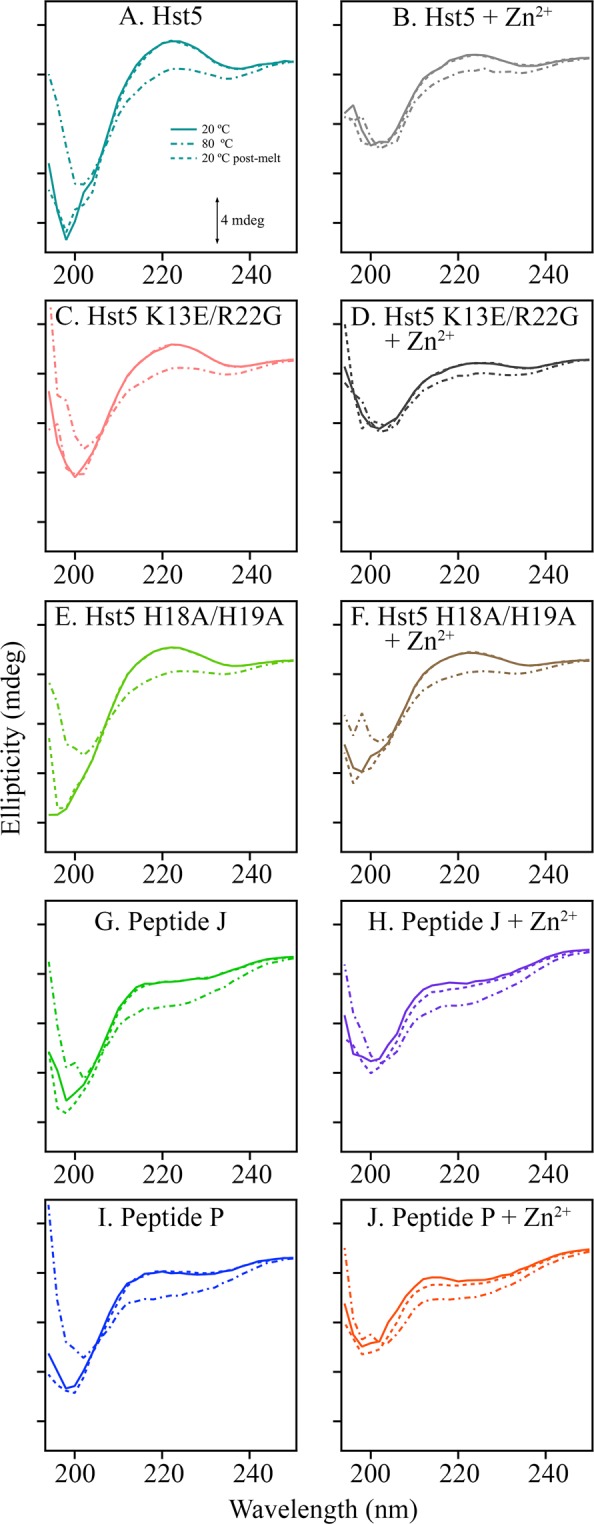
Figure 4.

CD spectra of peptides in the absence (left) or presence of (right) Zn2+. Samples are Hst-5 (A, teal), Hst-5 + Zn2+ (B, grey), K13E/R22G (C, peach), K13ER22G + Zn2+ (D, black), H18A/H19A (E, light green), H18A/H19A + Zn2+ (F, brown), Peptide J (G, green), Peptide J + Zn2+ (H, purple), Peptide P (I, blue), and Peptide P + Zn2+ (J, orange). Spectra were acquired at 20 °C (solid trace), then the samples were heated in a Peltier cell at 80 °C (dot-dashed trace), and subsequently cooled back to 20 °C (dashed trace). Tick marks denote 4 mdeg. Spectra were averaged from three to nine replicates. The peptide concentration was 100 μM, and equimolar ZnCl2 was added where noted. The buffer contained 5 mM HEPES pH 7.5.
