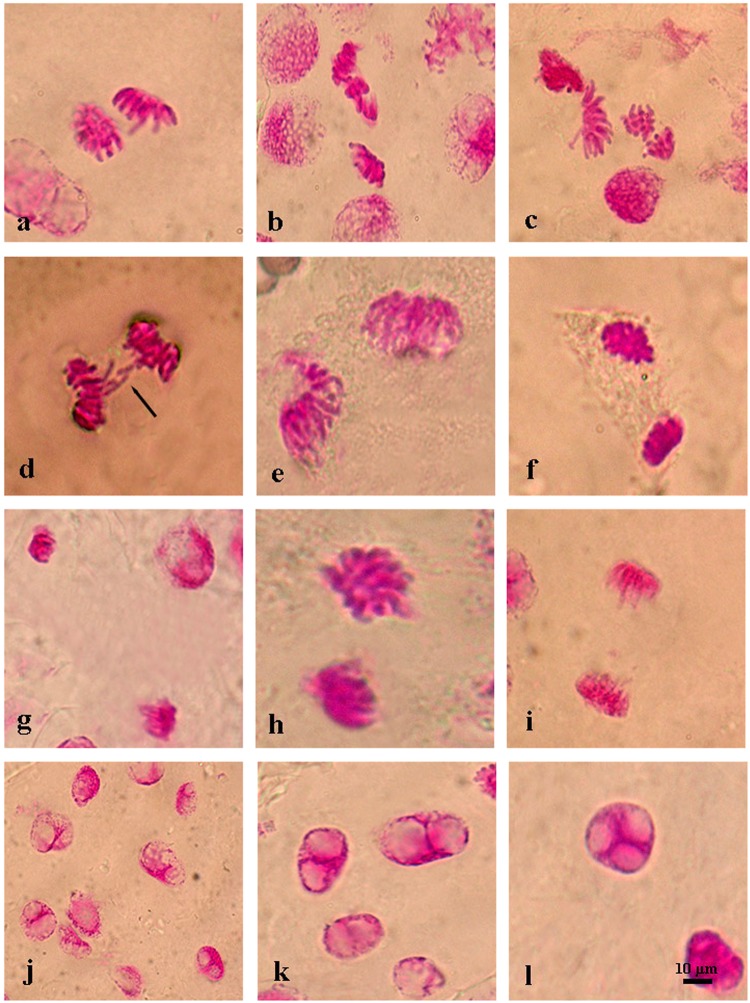
Figure 5.
Representative photos of anaphase level in the meristematic root tip cells of barley (H. vulgare L. cv. Bulbul-89) seeds pretreatment with and without l-carnitine under different salt stress concentrations. Vagrant chromosomes (a,c,d), spindle abnormalities in anaphase (b,c), anaphase bridge (d), fault polarization (e–h), alignment anaphase (i), binucleated cells (j,k), multinucleated cell (l) (→ represent aberrant chromosome). Scale bar: 10 µm.

