Fig. 5.
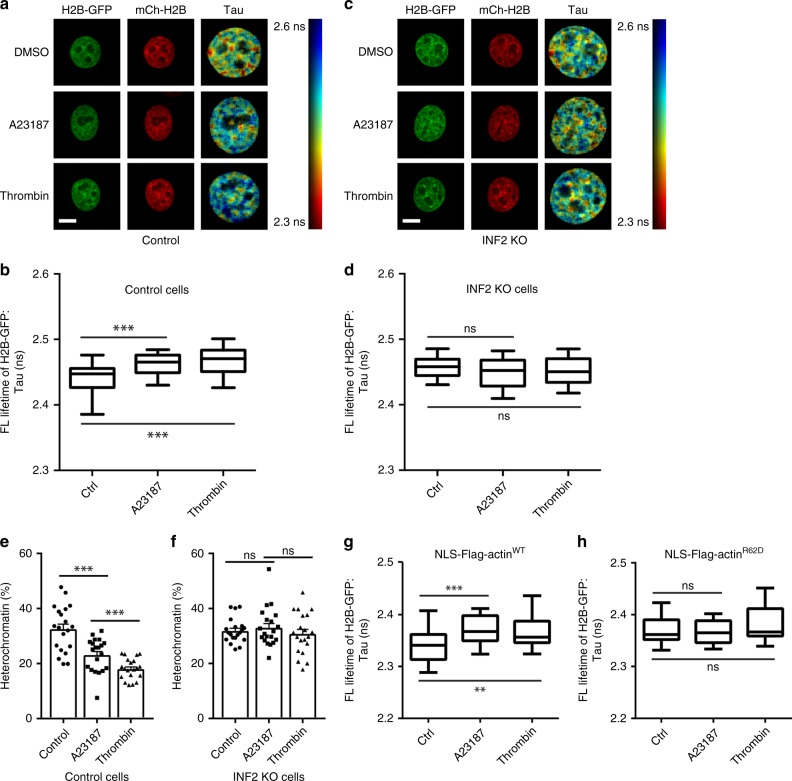
INF2 and nuclear F-actin are required for chromatin dynamics. a, c Representative images and fluorescence lifetime maps of control and INF2 KO cells expressing H2B-GFP and mCherry-H2B, where the ruler on the right depict GFP fluorescence lifetime. Cells were treated with DMSO, A23817, or thrombin for 15 min, before being fixed. Scale bars: 10 μm. b, d Control and INF2 KO cells expressing H2B-GFP and mCherry-H2B were measured for GFP fluorescence lifetime. Cells were treated with DMSO, A23187, or thrombin for 15 min. Thirty cells were measured for each condition. Boxes extend from the 25th to 75th percentiles. Middle line indicates median. Whiskers represent min to max with all points shown. One-way ANOVA test, ***p ≤ 0.001. e, f Cryopreserved cells were quantified for condensed chromatin based on EM images. n = 20 cells. One-way ANOVA test, ***p ≤ 0.001. Error bars: +s.e.m. g, h FLIM analyses of Flag-NLS-actin WT and Flag-NLS-actin-R62D cell nucleus showing chromatin reorganization after A23187 or thrombin. n = 30 cells for each condition. Boxes extend from the 25th to 75th percentiles. Middle line indicates median. Whiskers represent min to max with all points shown. One-way ANOVA test, **p ≤ 0.01, ***p ≤ 0.001. Source data are provided as a Source Data file

