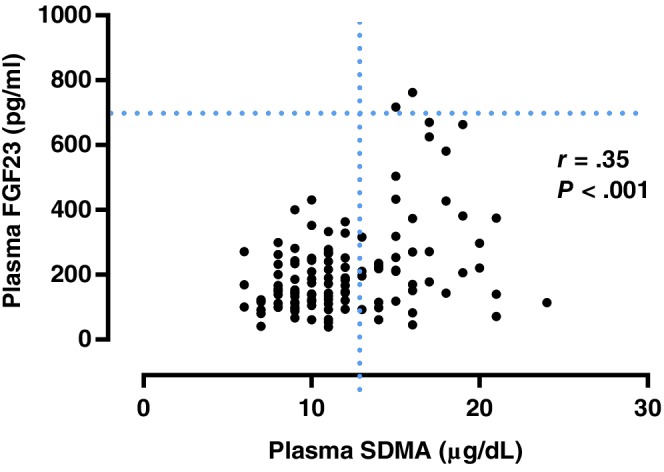
Figure 1.

Scatter plot illustrating the relationship between plasma symmetric dimethylarginine (SDMA) and plasma fibroblast growth factor 23 (FGF23) concentration. The broken lines represent upper reference interval for plasma SDMA16 (14 μg/dL) and plasma FGF2315 (700 pg/mL) concentrations. Outliers have been omitted from the graph
