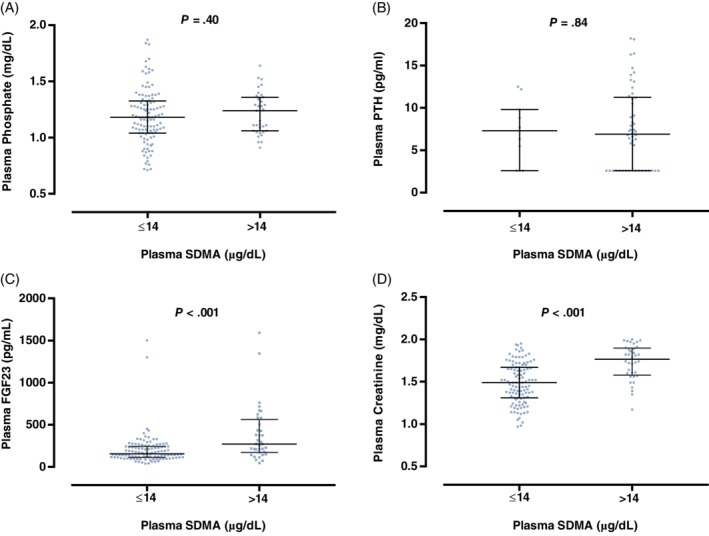
Figure 4.

Box plot illustrating A, plasma phosphate; B, parathyroid hormone (PTH); C, fibroblast growth factor 23 (FGF23); and D, creatinine concentration for cats grouped according to symmetric dimethylarginine (SDMA) status: SDMA within reference interval (≤14 μg/dL); SDMA above upper reference interval (>14 μg/dL).16 The boxes represent the 25th and 75th percentiles and the central lines represent median values. C, The broken line represents the upper reference interval for plasma FGF2315 concentration (700 pg/mL)
