Figure 1.

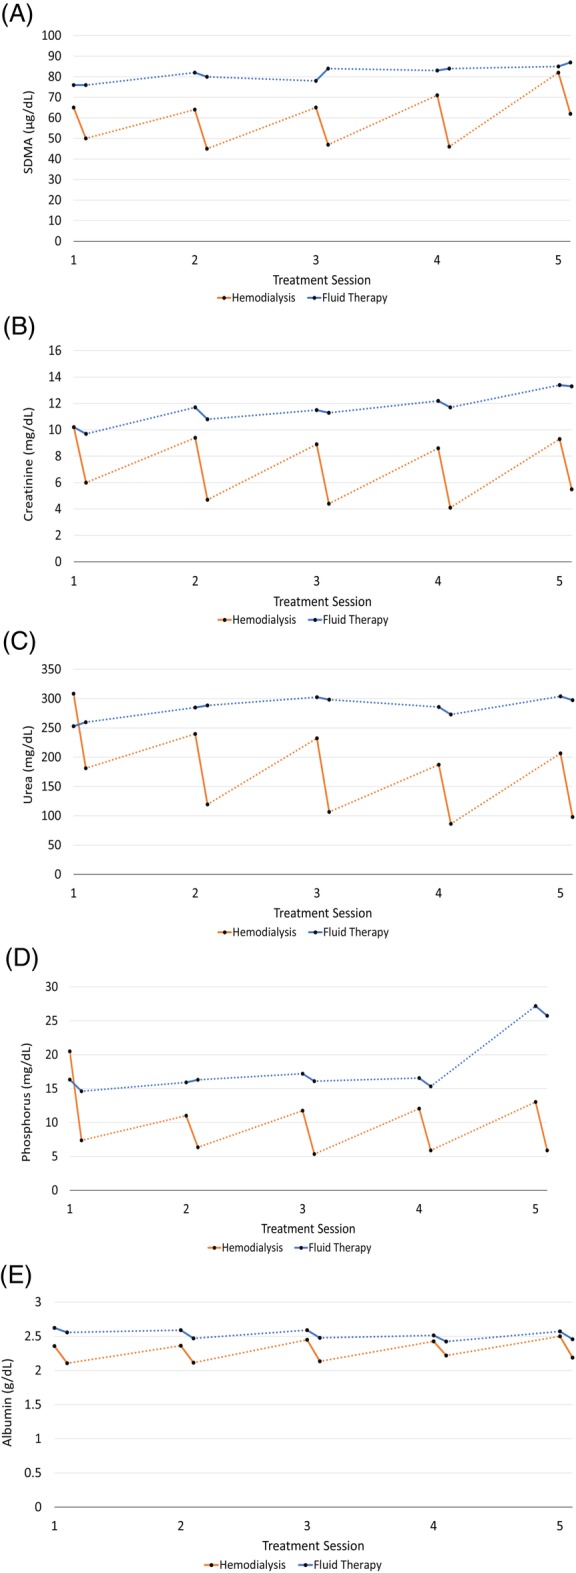
Mean analyte measures pre‐ and post‐treatment by treatment session. A, Symmetric dimethylarginine. B, Serum creatinine. C, Urea. D, Phosphorous. E, Serum albumin

Mean analyte measures pre‐ and post‐treatment by treatment session. A, Symmetric dimethylarginine. B, Serum creatinine. C, Urea. D, Phosphorous. E, Serum albumin