
Figure 4.
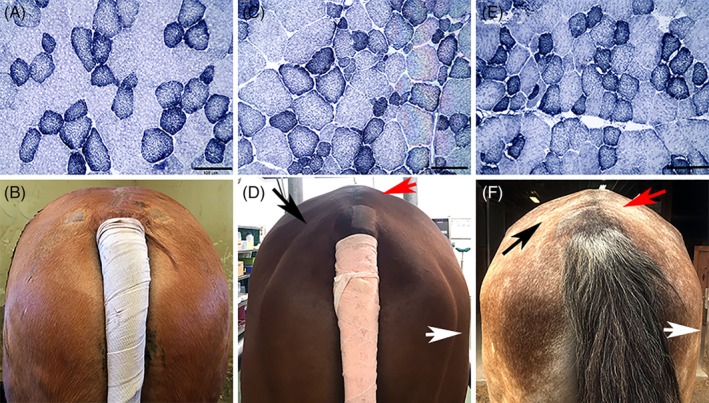
Cross sections of gluteal muscle stained with NADH‐TR (bar = 100 μm) and view of the hindquarter muscling of the respective horse. A, Muscle fibers with a normal mosaic staining pattern of oxidative and non‐oxidative fibers in a prospective α‐TP‐deficient horse on day 56 (×20). B, Normal muscling of the same Quarter Horse as in (A). C, Increased fiber size variation apparent in the gluteal muscle of a retrospective VEM horse (×20). D, Note the atrophy of the biceps femoris (white arrow), middle (red arrow), and superficial (black arrow) gluteal muscles in the same horse as shown in (C). E, Mild subsarcolemmal mitochondrial aggregates, anguloid atrophy, and smaller cross‐sectional area of gluteal muscle fibers in another retrospective VEM horse (×20). F, Note the atrophy of the biceps femoris (white arrow), middle (red arrow), and superficial (black arrow) gluteal muscles in the horse represented in (E). NADH‐TR, nicotinamide adenine dinucleotide tetrazolium reductase; α‐TP, alpha‐tocopherol; VEM, vitamin E‐responsive myopathy