
Figure 2.
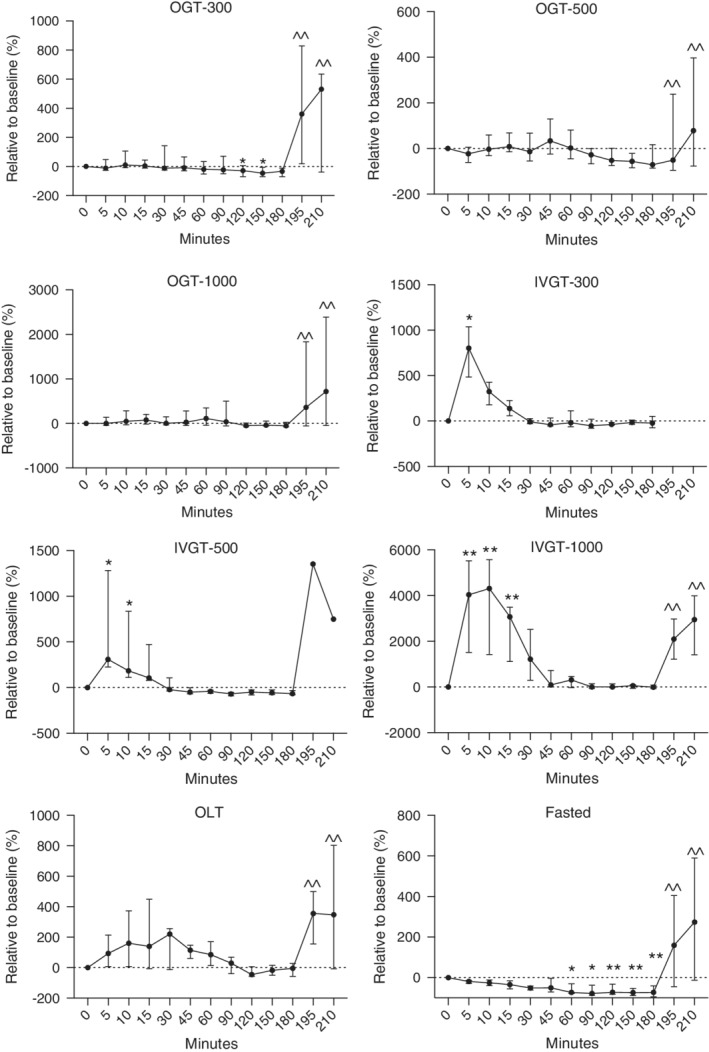
Relative changes in plasma insulin concentrations in healthy newborn foals administered glucose orally (300, 500, and 1000 mg/kg) and IV (300, 500, and 1000 mg/kg), lactose (1000 mg/kg), and fasted. Fasted, no treatment; IVGT, IV glucose test; OGT, oral glucose test; OLT, oral lactose test. Values (median, interquartile range [IQR]) presented relative (%) to time 0. Y axis scaling between figures is different to emphasize changes. *P < .05; **P < .01 compared to time 0; ^^P < .05 compared to 180 minutes