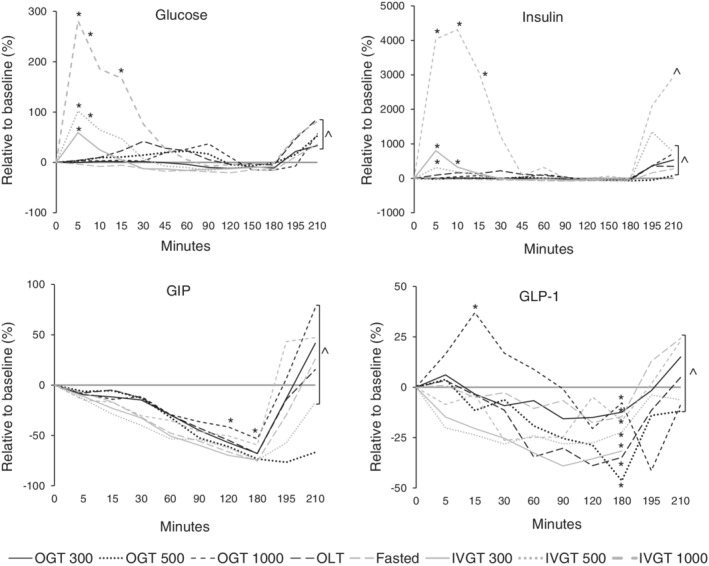
Figure 5.

Relative changes in blood glucose, insulin, GLP‐1, and GIP concentrations in healthy newborn foals. Fasted, no treatment; IVGT, IV glucose test; OGT, oral glucose test; OLT, oral lactose test. Values presented relative (%) to time 0. interquartile range [IQR] and statistical significance have been omitted but presented in Figures 1, 2, 3, 4
