Figure 6.

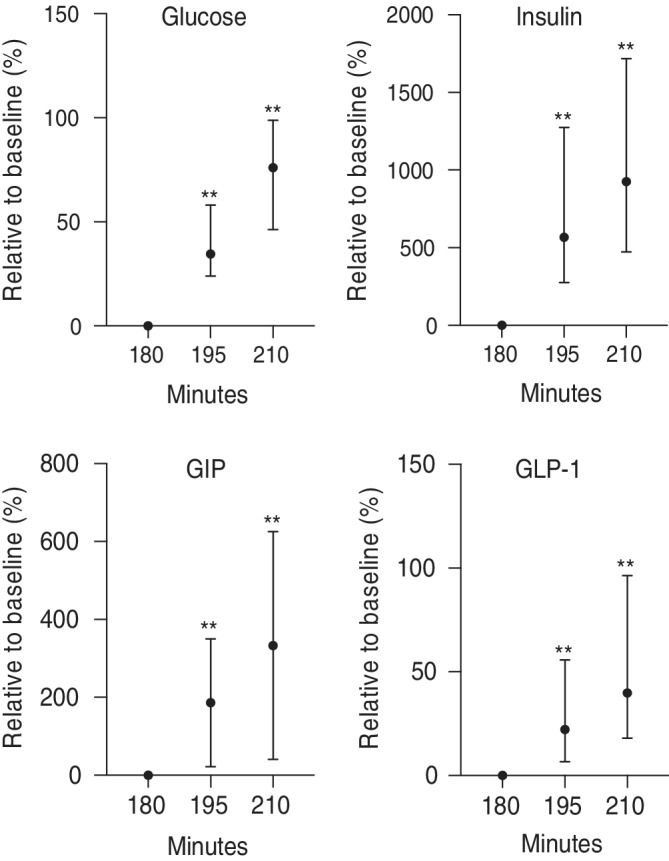
Relative changes in blood glucose, insulin, GIP, and GLP‐1 concentrations in all newborn foals after allowed to nurse. Values presented relative (%) to 180 minutes. **P < .01 compared to 180 minutes

Relative changes in blood glucose, insulin, GIP, and GLP‐1 concentrations in all newborn foals after allowed to nurse. Values presented relative (%) to 180 minutes. **P < .01 compared to 180 minutes