Abstract
Background
Advanced machine learning methods combined with large sets of health screening data provide opportunities for diagnostic value in human and veterinary medicine.
Hypothesis/Objectives
To derive a model to predict the risk of cats developing chronic kidney disease (CKD) using data from electronic health records (EHRs) collected during routine veterinary practice.
Animals
A total of 106 251 cats that attended Banfield Pet Hospitals between January 1, 1995, and December 31, 2017.
Methods
Longitudinal EHRs from Banfield Pet Hospitals were extracted and randomly split into 2 parts. The first 67% of the data were used to build a prediction model, which included feature selection and identification of the optimal neural network type and architecture. The remaining unseen EHRs were used to evaluate the model performance.
Results
The final model was a recurrent neural network (RNN) with 4 features (creatinine, blood urea nitrogen, urine specific gravity, and age). When predicting CKD near the point of diagnosis, the model displayed a sensitivity of 90.7% and a specificity of 98.9%. Model sensitivity decreased when predicting the risk of CKD with a longer horizon, having 63.0% sensitivity 1 year before diagnosis and 44.2% 2 years before diagnosis, but with specificity remaining around 99%.
Conclusions and clinical importance
The use of models based on machine learning can support veterinary decision making by improving early identification of CKD.
Keywords: artificial neural network, computer model, feline, machine learning, renal
Abbreviations
- CKD
chronic kidney disease
- EHR
electronic health record
- GFR
glomerular filtration rate
- IRIS
International Renal Interest Society
- KNN
k‐nearest neighbors algorithm
- LSTM
long short‐term memory
- RNN
recurrent neural network
- ROC/PR
receiver operator characteristic/precision recall
- SDMA
symmetric dimethylarginine
- UA/C
urine albumin to creatinine ratio
- UP/C
urine protein to creatinine ratio
- USG
urine specific gravity
1. INTRODUCTION
Chronic kidney disease (CKD) is defined as evidence of functional impairment or structural damage to the kidney resulting in a reduction in glomerular filtration rate (GFR). CKD has been described as the leading cause of mortality in cats over the age of 5,1 with a prevalence between 8% and 31% reported in geriatric cats.2, 3, 4 The etiology of many feline CKD cases remains unclear, with histological investigations highlighting nephritis and renal fibrosis that might have resulted from a range of underlying causes including toxic insults, hypoxia, chronic glomerulonephritis, chronic pyelonephritis, upper urinary tract obstructions, and viral infections.5 The prognosis for cats with CKD depends on the severity of the disease at the time of diagnosis, with cats identified at IRIS stage 4 reported to have a 9‐ to 25‐fold shorter life expectancy than those diagnosed at IRIS stage 2.6, 7, 8 Early detection of CKD allows the implementation of care pathways that can slow the progression of the disease, improving clinical outlook and quality of life, as well as the avoidance of situations that might cause worsening of kidney function and acute kidney injury, such as administration of NSAIDs.9
A single, accurate biomarker to assess renal function in clinical practice does not currently exist.10 Whereas the measurement of GFR provides a direct assessment of renal function, accepted methods are technically challenging to implement in clinical settings. Consequently, serum creatinine remains the standard surrogate for GFR, as part of the initial diagnosis as well as when staging the disease using recognized criteria (eg, IRIS11). Further traditional clinical biomarkers, including urea, proteinuria (an elevated urine protein to creatinine ratio [UP/C]), blood pressure, and urine specific gravity (USG) might also be referenced as part of the diagnosis with UP/C and blood pressure used to substage cats when deciding on the appropriate care pathway. More recently, the use of serum symmetric dimethylarginine (SDMA) has become popular in clinical practice, due to early evidence that it is responsive to changes in renal function sooner than serum creatinine, enabling the early detection of CKD in non‐azotemic cats.12 Additionally, fibroblast growth factor‐23 (FGF23) concentration, an important factor in the regulation of phosphate and vitamin D metabolism, increases in the circulation before development of azotemia as GFR declines.13 These more recent CKD biomarkers represent progress in the development of diagnostic tests to detect CKD in cats with greater sensitivity or at an earlier stage, but due to the complex nature of the disease, further research is needed to fully understand the clinical value of these approaches.
Alongside the search for novel biomarkers, there has been growing interest in the potential diagnostic value that can be leveraged through deep analysis of large sets of health screening data collected as part of routine veterinary practice. Prospective studies using data from cats screened through veterinary practices in London have demonstrated that routine measures of renal function do predict the onset of azotemia within 12 months of screening.14 Applying a multivariable logistic regression approach to longitudinal clinical data, plasma creatinine concentration together with a measure of proteinuria (either UP/C or urine albumin to creatinine ratio [UA/C]), successfully differentiate between groups of cats that develop azotemic CKD within 12 months and those that do not. The performance of this model in terms of sensitivity and specificity was, however, insufficient for use in clinical practice, likely due to the small data set used. Therefore, it seems appropriate to apply the same approach in a big data setting, building on recent advances in deep machine learning methodology coupled with data availability. In human health care, machine learning models have been used to assess risk and inform practice management,15 and predict individual outcomes,16, 17 length of stay,18 recommend treatments,19 and personalized medicine.20, 21 Big data, deep learning strategies therefore offer an opportunity to develop early diagnosis algorithms for CKD.
In this study, we used a data set of 106 251 individual cat electronic health records (EHRs) from primary care veterinary practice to build a model for CKD risk at a given point in time based on current and past EHR data. This model was subsequently evaluated with an independent data set for use at the time of clinical diagnosis as well as for use in the years before clinical diagnosis. Findings are discussed in terms of clinical practice and opportunities for new clinical care pathways.
2. METHODS
2.1. Data source and initial cleansing
Data were extracted from electronic health records (EHRs) of cats visiting Banfield Pet Hospitals (Vancouver, Washington) between January 1, 1995, and December 31, 2017. At the close of this time period, Banfield operated over 1000 hospitals in 42 US states. We excluded information collected from cats before the age of 1.5 and after the age of 22 years. With the further inclusion criterion of at least 3 clinic visits per cat this yielded a sample of 910 786 cats. The sample contained domestic short‐, medium‐, and long‐haired cats and over 50 pedigree breeds. Extreme outliers for blood and urine tests—more than 6 SDs above the maximum of the normal range—were set to missing. Every visit with blood or urine data was included in the modeling data set. Visits with no blood or urine data were only used to assess a cat's diagnosis history.
Each individual EHR included patient demographic data (age, breed, body weight, and reproductive status), blood and urine test results, and clinical information (formal diagnosis and unstructured medical notes). In total, 35 types of information were selected as features for a CKD prediction model. Data points were primarily collected during or around hospital visits, with individual visits timestamped meaning that the data was intrinsically longitudinal.
2.2. CKD status and age at evaluation T0
Electronic health records in the study data set were classified in 3 CKD status groups (Figure 1). The first group consists of EHRs with a formally recorded CKD diagnosis (“CKD”). The age of the first CKD diagnosis was used as the age at evaluation (T0). For this group, data collected more than 30 days after the diagnosis was excluded (an additional 30‐day window was included to capture serum, blood, or urine test data that was entered into the database shortly after the diagnosis visit).
Figure 1.
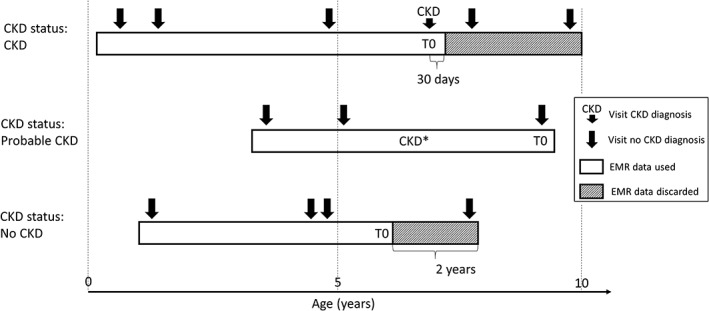
Schematic representation of CKD status assignment, EHR data use, and reference time T0 scaling for 3 hypothetical cat EHR profiles. CKD* indicates evidence for CKD in blood or urine analytes or medical notes. CKD, chronic kidney disease; EHR, electronic health record
Electronic health records without a formal CKD diagnosis, but with at least 2 CKD‐suggesting data points from the following list: blood creatinine above normal values, USG below normal values, and “CKD,” “azotemic,” “Royal Canin Veterinary diet Renal” or “Hill's prescription diet k/d” in the medical notes were classified as “probable CKD.” Whereas the exact reason for a lack of a formal diagnosis remains uncertain for these EHRs, it is likely that the veterinarian was unsure about the diagnosis or did not fill in a formal diagnosis for procedural reasons. An example of the latter is a diagnosis based on blood or urine test results received after the hospital visit and policy not allowing a formal diagnosis without the cat being present. For this group the age at evaluation (T0) was set to the age at last available visit, and the complete EHR was used.
All EHRs that were not included in the 2 previous groups and that have at least 2 years of data (recorded visits) at the end of the EHR to validate absence of CKD were assigned a “no CKD” status. For these EHRs, age at evaluation (T0) was set as the age at the last visit minus 2 years, and the last 2 years' data were removed from the EHR.
2.3. Data sets for model building and testing
The truncated EHRs were further filtered based on their information content by imposing that the EHR should include at least 2 visits with accompanying blood creatinine data. This resulted in a data set with 106 251 individual cat EHRs. This data set was randomly split in 2 parts. In total, 70 687 EHRs or approximately 67% of the data was used to build the CKD prediction model. The remaining 35 564 EHRs or approximately 33% were used as a test set to evaluate the model performance. Both data sets were kept separate throughout the analysis to exclude any bias at the testing stage. Prior to use, missing information in the blood and urine test data was imputed using all available blood and urine data but not the CKD status information. This is needed because neural networks require complete data and was done separately for model building and test data sets to avoid any flow of information between the 2 data sets. Only records with at least some blood or urine data were imputed to fill in missing data.
2.4. Model building
Prior to use, the model building data set was filtered further ensuring that only the best characterized EHRs were used for learning. EHRs with status “probable CKD” were removed as were 7549 “CKD” and “no CKD” EHRs with “acute kidney injury” or “urinary tract infection” as comorbidity. This left 53 590 EHRs of which 9586 were “CKD” and 44 004 “no CKD.” To enable the model to work well for early detection of CKD, this data set was then augmented22 by adding truncated versions of the original EHRs (last k visits removed with k ranging from 1 to the total number of visits − 1). This enriched the data set with EHRs having a gap of up to 2 years between the last visit seen by the model and the time of diagnosis.
The first step toward a CKD prediction model was to select a limited set of features to be included. Feature selection was conducted by a top‐down and bottom‐up wrapper method23 using a standard recurrent neural network (RNN24 Figure 2) with a 3‐5‐3 hidden layer structure (see Supporting Information for background on neural networks). This RNN model was selected based on exploratory studies (results not shown), where it outperformed alternatives such as the k‐nearest neighbor with dynamic time warping (KNN‐DTW)25 and a long short‐term memory RNN alternative (LSTM26 Figure 2). The RNN was implemented with a tanh activation function in the hidden layers and softmax for transforming the output layer into a CKD probability score. Backpropagation through time was used for training with the RMSprop gradient optimization algorithm. Model performance was evaluated based on the F1 cross‐entropy in a 3‐fold cross‐validation setup. We used the F1 cross‐entropy as a metric because it balances sensitivity and specificity independent of CKD incidence.
Figure 2.
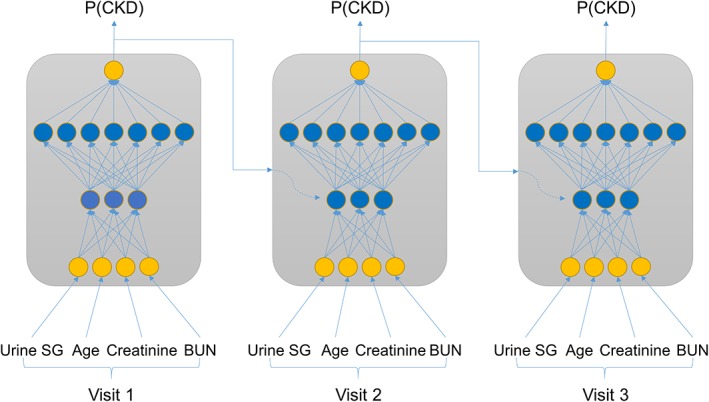
Schematic representation of recurrent neural network (RNN) approaches. In a standard RNN the input feature data at every visit (here as an example USG, age, creatinine and blood urea nitrogen[BUN]) are combined in nonlinear ways through 2 hidden layers with 3 and 7 nodes, respectively, and merged with the prior CKD probability—P(CKD) to yield an updated P(CKD). The weights and activation functions that define the nonlinear pattern are the same for every visit. The model output is P(CKD) at the last visit. A long short‐term memory (LSTM) approach is conceptually similar but has additional mechanisms to forget part of the information from prior visits when combining these with the current visit information. CKD, chronic kidney disease
Next, a full model architecture screen was performed with the selected features for the above‐mentioned RNN structure as well as for a LSTM alternative. For both structures, different configurations of 1 to 5 hidden layers were tested with 3 to 200 nodes per layer. The setup was the same as above except that 20% dropout was added to avoid overfitting.27 Evaluation was based on the F1 score in a 10‐fold cross‐validation setup.28 Finally the best model configuration was fine‐tuned with respect to the training time in the same cross‐validation setup.
2.5. Model testing
Unbiased model performance was assessed by applying the selected prediction model to the test data set. Predictions were performed for all EHRs in the “CKD,” “probable CKD,” and “no CKD” groups. Results were interpreted at the level of the crude model output—the probability of a CKD diagnosis—as well as after categorization into “no CKD” and “CKD” using P = .5 as the cutoff point. Categorical results for “CKD” and “no CKD” groups were used to compute sensitivity (proportion of true positives, “CKD” status predicted as CKD) and specificity (proportion of true negatives, “no CKD” predicted as no CKD) estimates, respectively. Cats designated “probable CKD” could not be assessed for sensitivity or specificity as the true diagnosis state was unknown. Confidence intervals for sensitivity and specificity estimates were calculated using the normal approximation. Odds ratio tests for the comorbidity analysis (Table 3) were done with a standard chi‐square test.
Table 3.
Incidence (%) of the 20 most common comorbidities for “No CKD” cats differentiated by their predicted CKD status. The odds ratio for the comorbidity in “predicted as no CKD” vs “predicted as CKD” is given with an uncorrected P value for a hypothesis test with odds ratio = 1 as null hypothesis
| Comorbidity | Incidence in predicted “no CKD” (%) | Incidence in predicted “CKD” (%) | Odds ratio | P value |
|---|---|---|---|---|
| Hyperthyroidism | 3.18 | 22.03 | 0.116 | <.001 |
| Diabetes mellitus | 3.37 | 13.56 | 0.222 | <.001 |
| Hepatopathy | 4.63 | 11.86 | 0.361 | <.001 |
| Underweight | 5.8 | 13.56 | 0.392 | <.001 |
| Murmur | 10.32 | 19.49 | 0.475 | .002 |
| Arthritis | 2.23 | 6.78 | 0.313 | .002 |
| Malaise | 11.08 | 18.64 | 0.544 | .011 |
| Constipation, conservative | 3.29 | 6.78 | 0.468 | .040 |
| Gastroenteritis, conservative | 5.77 | 10.17 | 0.541 | .046 |
| Vomiting, conservative | 8.87 | 13.56 | 0.620 | .078 |
| Inflammatory bowel disease | 1.4 | 3.39 | 0.406 | .079 |
| Crystalluria | 5.37 | 1.69 | 3.288 | .096 |
| Enteritis, conservative | 3.29 | 0.85 | 3.984 | .169 |
| Urinary tract infection | 8.02 | 5.08 | 1.627 | .247 |
| Respiratory disease, upper | 11.51 | 9.32 | 1.265 | .459 |
| Urinary tract disease | 4.2 | 3.39 | 1.250 | .662 |
| Obesity | 14.12 | 15.25 | 0.913 | .724 |
| Inappropriate elimination | 6.4 | 5.93 | 1.085 | .835 |
| Cystitis | 21.94 | 21.19 | 1.045 | .844 |
| Colitis, conservative | 6.98 | 6.78 | 1.032 | .932 |
Abbreviation: CKD, chronic kidney disease.
The ability for the model to predict CKD ahead of the definitive diagnosis was evaluated by truncating the EHRs to various time points before age at diagnosis for the “CKD” group and allowing the model to only see the truncated data. Sensitivity and specificity estimates were generally calculated across the entire test data set. For 1 year before diagnosis setting, additional breakdown analyses were performed reporting sensitivity by year of diagnosis (with the data from 1995 to 2010 pooled) and by state for the 11 US states with the highest number of EHRs.
2.6. Software
General data management, statistical analyses, and plots were performed using R version 3.4.329 and imputation was done with the MissForest package version 1.4.30 Machine learning work was done using Tensorflow version 1.3 (https://github.com/tensorflow/tensorflow/tree/r1.3) and interfaced from within Python using Keras Deep Learning library version 2.0.8 (https://faroit.github.io/keras-docs/2.0.8) run on a 500‐core, 4 GB memory per core Dell PowerEdge R730xd cluster with dual Intel E5‐2690 v3 CPUs.
3. RESULTS
3.1. Study data set and clinical CKD diagnosis
This study was performed on an extract of 106 251 individual cat EHRs of Banfield Pet Hospital visits between 1995 and 2017. Demographics of this sample differentiated by CKD status and summaries of blood and urine test data at the time of diagnosis are shown in Table 1. The CKD prevalence in this sample was 17% when based on the “CKD” status group only, and 42% when including “probable CKD” cats in addition. The prevalence of missing data was approximately 9% for most of the blood chemistry measures and up to 62% for urine test results, which are not routinely measured on every visit. Results are very similar after breakdown in a model building and test data set (Table S4) showing that these can be used as independent samples of the same population.
Table 1.
Demographics and summaries for the study data set. Mean and SD are shown for continuous measures
| No CKD | Probable CKD | CKD | |
|---|---|---|---|
| Number of cats | 61 239 | 26 604 | 18 408 |
| Mean visits per cat | 5.4 | 10.9 | 8.2 |
| Male to female ratio | 1:0.95 | 1:1.14 | 1:0.92 |
| Mean (SD) age (years) at T0 | 6.6 (3.2) | 10.7 (3.8) | 13.1 (3.7) |
| Mean (SD) weight (kg) at T0 | 5.54 (1.49) | 5.24 (1.63) | 4.49 (1.49) |
| Mean (SD) blood urea nitrogen (mg/dL) at T0 | 24.33 (4.27) | 32.92 (21.75) | 49.85 (27.11) |
| Mean (SD) creatinine (mg/dL) at T0 | 1.71 (0.33) | 2.19 (1.67) | 3.46 (2.13) |
| Mean (SD) urine SG at T0 | 1.049 (0.008) | 1.036 (0.014) | 1.023 (0.011) |
| Percent missing creatinine values | 7% | 10% | 11% |
| Percent missing urine SG values | 68% | 57% | 56% |
Abbreviations: CKD, chronic kidney disease; SG, specific gravity.
As multiple guidelines for the diagnosis of CKD exist, and these have evolved during the period captured in this study, we explored how the CKD status as used in this study relates to various diagnostic measurements routinely assessed when making CKD diagnoses. Cats with status “CKD” were generally older, and have higher creatinine levels and lower USG than cats with “no CKD” status (Figure 3). These results support the quality of the CKD diagnosis within the Banfield database and provide confidence in the data used to build the model. For all criteria assessed, there was an overlap in the distributions between CKD status groups such that any single parameter alone does not have sufficient discriminatory power for diagnosis. This intrinsically multifactorial nature of feline CKD presents an ideal setting for prediction models to add clinical value.
Figure 3.
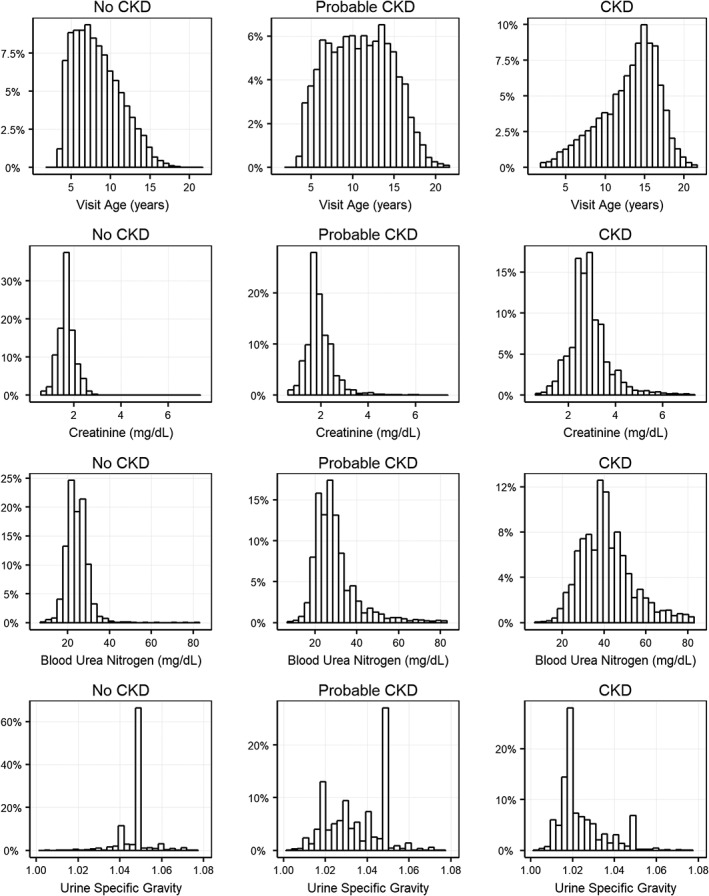
Distribution of age at evaluation (T0), creatinine, blood urea nitrogen and urine specific gravity in the study data set differentiated by CKD status. CKD, chronic kidney disease
To illustrate the data used in this study, we show creatinine, blood urea nitrogen, and USG for 8 randomly sampled EHRs from the 3 CKD status groups (Figures 4 and 5). In this small sample, the “no CKD” EHRs clearly differ from the “probable CKD” and “CKD” EHRs. At the same time, there is considerable heterogeneity within the latter groups with quite some changes happening before the time of diagnosis. This shows that a prediction model should not only consider multiple factors at the time of diagnosis, but also include information on these at different time points before diagnosis as well.
Figure 4.
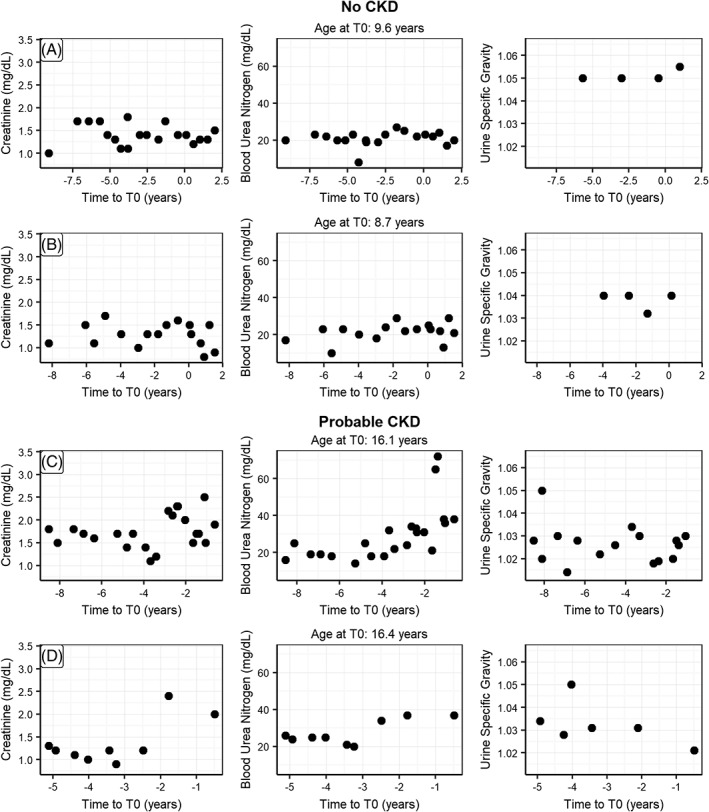
Randomly picked EHRs for individual cats with CKD status “No CKD” (A,B), “Probable CKD” (C,D) showing the observations for creatinine, blood urea nitrogen and urine specific gravity as a function of time before diagnosis (T0). CKD, chronic kidney disease
Figure 5.
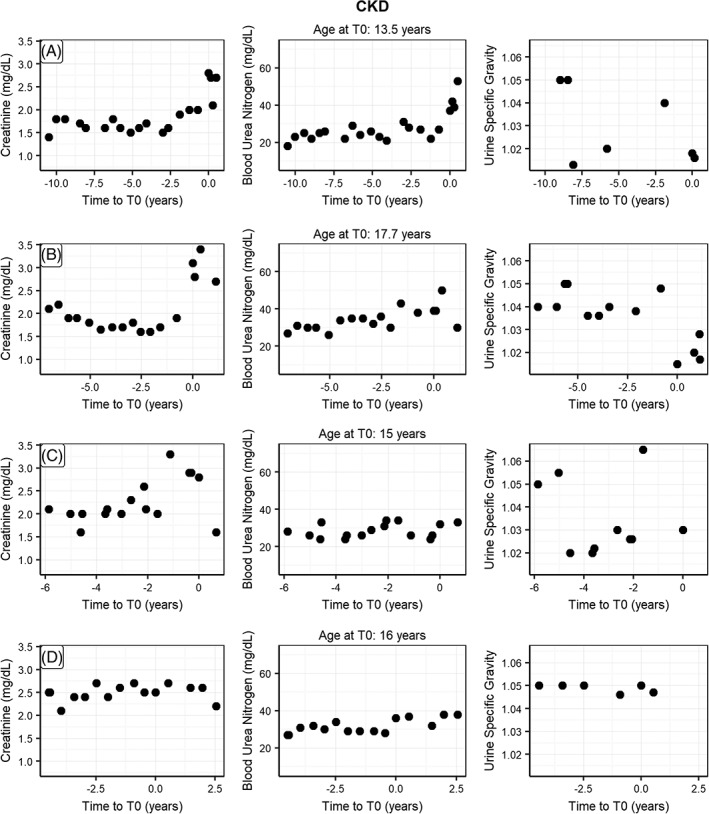
Randomly picked EHRs for individual cats with CKD status “CKD” (A‐D) showing the observations for creatinine, blood urea nitrogen and urine specific gravity as a function of time before diagnosis (T0). CKD, chronic kidney disease
3.2. Building a prediction model for CKD
We used a standard RNN with a 3‐5‐3 hidden layer structure as a starting point for a prediction model for CKD that acknowledges both the multifactorial and temporal aspects of CKD diagnosis. Using this type of model with 35 candidate factors or features was impractical both for training the model as well as for using it in practice later. Therefore, we first set out to select the most important features using a top‐down and bottom‐up feature selection strategy on the training data set. This approach showed that model performance in terms of the cross‐entropy score improved by adding features up to 4 and plateaued thereafter (data not shown). As a result, we decided to build a prediction model with the following features: creatinine, blood urea nitrogen, USG, and visit age.
With these 4 features, we then determined the best structure for the hidden layers—number of layers and nodes per layer—for a standard RNN and a LSTM variant. Results in terms of cross‐entropy score (Figure 6) and the notion that higher cross‐entropy scores are better, demonstrated that RNN models were slightly superior to LSTM models. For the RNN, the simpler models with a small number of nodes were better than the complex ones. A 2‐layer RNN with a 3‐7 structure was best. Optimizing this model for training time by testing different numbers of epochs resulted in a final RNN model with a 3‐7 structure trained over 16 epochs.
Figure 6.

F1‐score (measure of model performance) as a function of model architecture (number of neurons, indicating complexity) for recurrent neural network (RNN) and long short‐term memory (LSTM) RNN alternative prediction models. A high F1‐score indicates a better performing model
3.3. Detecting CKD near the point of diagnosis
To determine the performance of the CKD model around the time of diagnosis we applied it on the test data set of 40 205 complete EHRs that were not used for building the model. The model (Table 2) showed a sensitivity of 90.7% (6885/7593) based on the status “CKD” and a specificity of 98.9% (22 534/22 781) based on the status “no CKD” (Table 2). Predictions for the “probable CKD” group are split over the “CKD” and “no CKD” predictions. These were not used in the calculations of sensitivity and specificity as there was no clear clinical diagnosis for this group.
Table 2.
A comparison of number of cats with diagnosed CKD status against predicted status at T0. “Probable CKD” cats are included in this table to represent how the model would have predicted them. No true CKD status is known for these cats
| Predicted “no CKD” | Predicted “CKD” | Total | |
|---|---|---|---|
| Status “no CKD” | 22 534 | 247 | 22 781 |
| Status “probable CKD” | 4223 | 5608 | 9831 |
| Status “CKD” | 708 | 6885 | 7593 |
| Total | 27 465 | 12 740 | 40 205 |
Abbreviation: CKD, chronic kidney disease.
Distributions of the raw CKD prediction model output (Figure 7) show similarly clear pictures for “no CKD” and “CKD” status groups: positioned close to 0 for “no CKD” and close to 1 for “CKD.” The “probable CKD” status group is more mixed with about 30% close to 1, likely missed or unrecorded CKD diagnoses, and about 15% close to 0, likely true negatives. The remaining 55% is spread out between 0 and 1 (the total of the bars adds up to 100%), which could represent a complicated pathology as well as an early‐stage CKD pattern.
Figure 7.
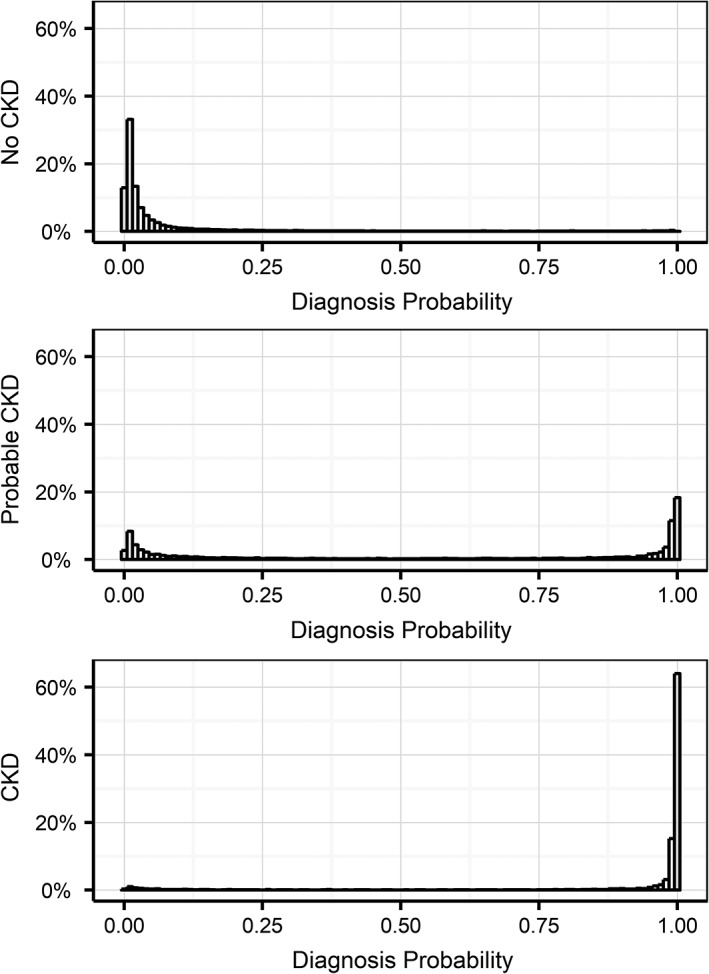
Distribution of model probability outputs for the 3 different groups predicted at evaluation T0 in the test data set. A diagnosis probability p(CKD) of greater than 0.5 denotes a prediction of future CKD risk, and a prediction below 0.5 predicts low future CKD risk for that cat. CKD, chronic kidney disease
We also evaluated whether misclassification for “no CKD” cats was linked to specific comorbidities by comparing comorbidity incidence between correctly and incorrectly classified “no CKD” cats. We found that hyperthyroidism and diabetes mellitus are clearly overrepresented in falsely positive classified cats as are hepatopathy and underweight (Table 3).
The influence of the amount of prior information (number of visits) on the prediction sensitivity is an important consideration when evaluating the clinical implementation of such an approach. The general model performance data does not address this consideration because it is based on the complete sample of EHRs that includes a range of visits from 1 to 15. Therefore, we next examined the model sensitivity by number of visits in the EHR before the visit where the diagnosis was made. We found that sensitivity clearly benefits from prior information as it increases up to approximately 90% by using at least 2 visits before the diagnosis (Figure 8). This shows that historical information contributes to the prediction of future CKD diagnosis up to a horizon of 2 visits that is on average 2 years.
Figure 8.
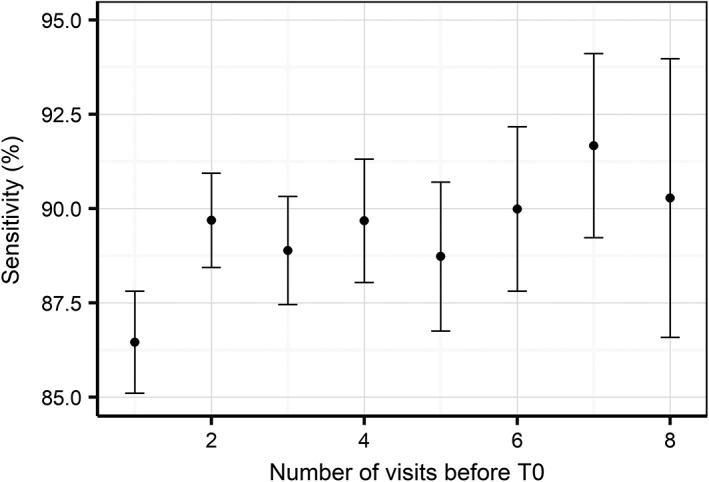
Model sensitivity with 95% confidence interval as a function of the number of visits before the time of diagnosis. Note that confidence intervals increase as there are less EHRs with large numbers of visits before the time of diagnosis
3.4. Using the model for early detection
As the model detects CKD signals at least 2 years before diagnosis for some cats, we evaluated its use for early prediction of future disease risk. To achieve this, we truncated EHRs for the “CKD” and “no CKD” groups at different points before diagnosis (eg, for a 1 year early prediction we removed all information between the diagnosis and 1 year before) and then evaluated the ability of the model to predict future onset of CKD. As expected, sensitivity (Figure 9) decreased when increasing the time between prediction and diagnosis, although of the cats that went on to develop CKD 63.0% were correctly predicted 1 year before diagnosis, 44.2% 2 years before diagnosis, and 23.9% as far as 3.5 years before clinical diagnosis. Using the 1 year before clinical diagnosis setting as an example, we find that the reported sensitivity estimates are consistent across the year of diagnosis and across US states (Tables S5 and S6).
Figure 9.
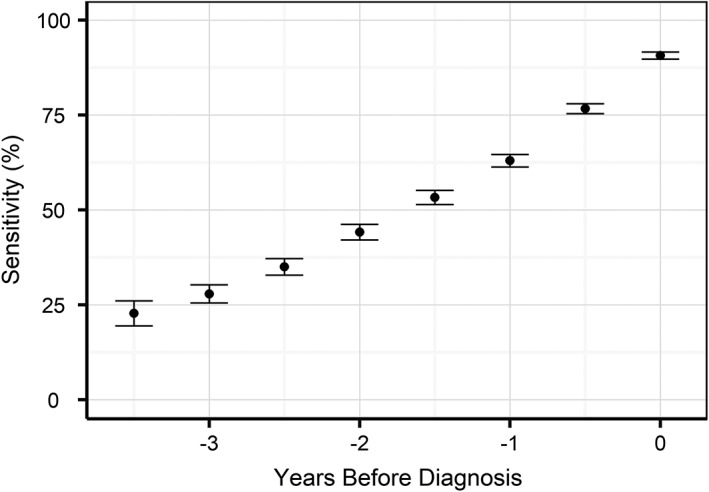
Model sensitivity with 95% confidence intervals as a function of the time before diagnosis, where the prediction was made only with the data up to that point
To assess specificity in this context, truncation of the EHRs does not make sense as cats remain “no CKD” at all earlier visits to clinic. Therefore, we instead calculated specificity as a function of age at evaluation (Figure 10). Specificity was consistently above 98% until an age of 11 years and declined thereafter reaching 80% for an age of 15 years. Less than 20% of veterinary visits in this data set were above the age of 11.
Figure 10.
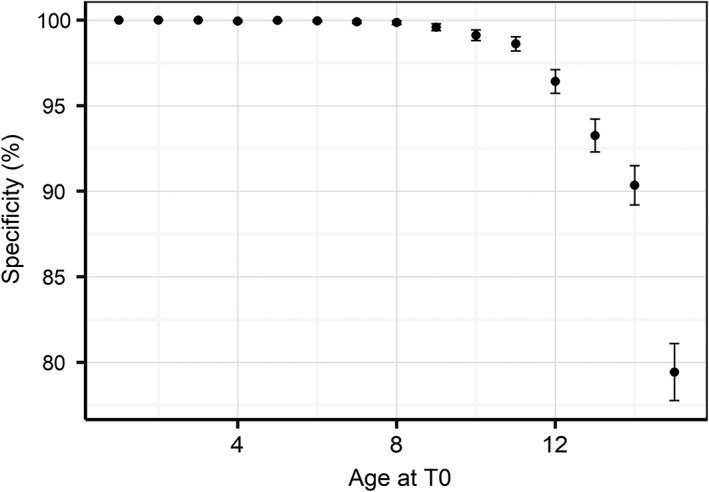
Model specificity with 95% confidence intervals as a function of age at diagnosis
4. DISCUSSION
Here we applied advanced computational modeling approaches to a large, rich data set of EHRs from routine veterinary practice to derive a model for CKD risk at a given point in time based on current and past EHR data. We evaluated the performance of this model at the time of diagnosis, as well as for predicting the risk of cats developing CKD in the future. From an initial set of 35 candidate features, the model was refined down to 4 (creatinine, blood urea nitrogen, USG, and visit age). When predicting CKD near the point of diagnosis, the model displayed a sensitivity of 90.7% and a specificity of 98.9%. Interestingly, prediction of CKD risk was possible with 63.0% and 44.2% sensitivity, 1 and 2 years before diagnosis, respectively. Specificity was over 99% at both advanced time points, which translates into an extremely low false‐positive rate; clearly a key factor when considering diagnostic performance in clinical settings.
The selected model features that enable the prediction of the onset of CKD are routinely referenced by veterinarians when CKD is suspected, and are therefore mechanistically implicated in the disease etiology. Creatinine and blood urea nitrogen concentrations are filtration markers and their retention in the circulation can indicate reduced functional renal mass. As urea more readily crosses lipid membranes than creatinine and the permeability of the collecting tubule and duct to urea is selectively increased by antidiuretic hormone, urea is retained in the blood not only when functional kidney mass is reduced, but also when the body is responding to water deficits and activating mechanisms that conserve water. Inclusion of both creatinine and urea in this model might help the system avoid falsely identifying acutely volume depleted animals as having CKD; under these circumstances, urea would change far more than plasma creatinine. Serial monitoring of creatinine is more sensitive in identifying loss of kidney mass than a single one‐off measurement, as creatinine production can be influenced by nonrenal factors (eg, muscle mass10). However, the strength of the approach described here is that the algorithm identifies changes over time in a range of diagnostic variables that together are indicative of progressive deterioration in renal function. These often subtle changes over time might be missed by a veterinarian particularly when the laboratory values have not moved outside the normal reference range.
USG is a measure of the ability of the kidney to excrete solutes (mostly waste products) in excess of water, but as the functional kidney mass declines so does the USG. A urine sample from an animal with normal healthy kidneys can have varying USG depending on whether the animal needs to conserve or excrete excess water, and consequently a single assessment is difficult to interpret. Cats often retain some concentrating ability in IRIS stages 2 and 3 CKD with the urine only approaching the isosthenuric range as they approach IRIS stage 4 CKD.31 Interpreting serial data on USG in combination with plasma creatinine and blood urea nitrogen likely help the model to identify patterns predictive of falling kidney functional mass and differentiate these from natural fluctuations around normal or acute episodes of dehydration.
Finally, as CKD is primarily a disease of age it is not surprising that the age of the cat was selected as a feature in the final model. As highlighted in Table 1, the age profiles of the “no CKD” and “CKD” groups were different, but there was sufficient overlap to challenge the model on young as well as old cats. The proportions and age distributions represent the real distribution of cats seen by Banfield clinics over the last 20 years. Aging is associated with a range of chronic conditions and CKD is commonly diagnosed before or at the same time as hypertension, hyperthyroidism, and diabetes mellitus.32 To understand how the model performed in situations where multiple diagnoses were present in the EHR, we also evaluated whether misclassification for “no CKD” or “CKD” by the model was linked to specific comorbidities (Table 3). Hyperthyroidism and diabetes mellitus were overrepresented in false‐positive classified cats, most likely due to the nonspecific nature of the clinical measurements routinely employed to inform diagnoses across these conditions. It should be noted that the relative performance of the model was mildly influenced by these cases, but this is a challenge that veterinarians also encounter in clinical practice.
The selection of biomarkers presented in this model represents a combination of variables that gave high predictive accuracy under most clinical situations. Further work (beyond the scope of this paper) has highlighted that other biomarkers can be useful in predicting future CKD when applied using more complex combinations of models. These could, for example, function by reducing the loss of specificity when predicting very old cats (Figure 10) or help to separate other comorbidities (Table 3) more accurately. The other predictive biomarkers identified included urine protein, urine pH, and white blood cell count. The volume of missing values related to these variables in the historic data (due to them not being measured on all visits) has meant that they bring additional noise to the model as well as enhancing signal. Further testing with more complete data sets might show higher predictive power for these and other biomarkers.
Recently serum SDMA concentration has been suggested as an alternative marker of GFR, as it has been shown to correlate closely with plasma creatinine14 and plasma iohexol clearance in cats.33 Retrospective analysis of stored longitudinal samples collected as part of the management of a colony of cats used for nutrition studies showed that serum concentrations of SDMA increased outside of the laboratory reference range in 17 of 21 cats that developed azotemia before an increase in plasma creatinine was detected. On average, elevated SDMA was detected 17 months (range 1.5‐48 months) prior to elevated creatinine.12 The small group of cats and the retrospective nature of this study likely overestimate the sensitivity and specificity of SDMA as a predictor of the development of azotemic CKD. SDMA was not available for much of the time period over which the data used in the present study were collected. It is interesting to note that the algorithms devised from these large longitudinal data sets involving very large numbers of animals presenting to veterinary practices with a range of different diseases were able to predict the development and diagnosis of CKD even 3 years before its onset using data routinely collected in veterinary practice. Whether longitudinal measurement of SDMA would improve the predictive value of the algorithms developed in the present study warrants further research.
Although EHR data are undoubtedly clinically relevant, using it in a scientific setting was a challenge. As such, confirming the accuracy of the CKD diagnosis was an important first step. Data used to build and validate this model came from a very large number of clinics and veterinarians over a period of more than 20 years and cats with a formal CKD diagnosis showed blood and urine patterns that are consistent with currently accepted guidelines (Figure 3); this in itself provides confidence in the use of these data as a reference point to develop the model. Defining the health status of the complementary set of cats without a formal CKD diagnosis was more problematic. A subset of these, those that were classified as “probable CKD,” had clear indications for CKD in blood or urine test results or references in the medical notes that suggest CKD. This group of cats includes those where the veterinarian was unsure of the diagnosis (most likely because of conflicting information) or because the cat was in an early stage of the disease, or where for formal reasons they could not be diagnosed. Whereas many case‐control studies typically exclude these somewhat ambiguous patients, thus creating a wider space between the groups and enhancing the statistical significance of findings, we felt the inclusion of these during the training phase was important to provide additional context that we believe overall enhanced the predictive capability of the algorithm. We did not include this group when computing sensitivity, however, and we are aware that this could bias our estimates given that it could contain the more difficult cases to predict. For the other cats without a formal CKD diagnosis, we imposed a 2‐year window with observations and no CKD to be confident of their “no CKD” status. This could have reduced our specificity estimates as some might have had very early stage CKD that was diagnosed more than 2 years later.
The prognosis for cats with CKD depends on the severity of the disease at the time of diagnosis, with cats identified at IRIS stage 4 reported to have a significantly shorter life expectancy than those diagnosed at earlier stages.6, 7, 8 Early detection of CKD allows the early implementation of care pathways that can slow the progression of the disease, improving clinical outlook and quality of life, as well as the avoidance of situations that might cause worsening of kidney function and acute kidney injury.9 Consequently work continues to develop and validate novel diagnostic tools that support clinicians in the early diagnosis of CKD and represent an improvement in the clinical measures routinely applied in current veterinary practice (eg, plasma creatinine, USG); the limitations of which are well recognized. Here, we demonstrate overlap in the distributions of a range of routinely applied diagnostic criteria between cats with and without a CKD diagnosis (Figure 3). This highlights the intrinsically multifactorial nature of CKD, meaning that a single existing clinical parameter alone does not have sufficient discriminatory power to inform a diagnosis.
The CKD prediction model developed in this study brings several advantages for veterinary practice. The first is to support the veterinarian in making the right diagnosis based on blood and urine test data currently available for a particular case. Diagnosis is complicated by the multifactorial nature of CKD, with individual cats often displaying differences in the evolution of these clinical measurements (Figure 5), most likely due to subtle differences in the etiology and progression of the disease. One might even argue whether humans are able to learn all possible patterns because these can be quite different between individual cats (compare, for example, CKD cats in Figure 5E with Figure 5H). Therefore, having an algorithm highlighting a risk for CKD can be a very helpful addition to a practicing veterinarian's toolkit. A second advantage is the ability of the algorithm to predict CKD risk ahead of conventional diagnostic strategies—with a success (sensitivity) of 44.2% 2 years before diagnosis and of 63.0% 1 year before diagnosis. To enable this early detection, however, it is important that cats not only regularly (biannual or annual) visit a veterinarian, but also that a blood and a urine sample is taken at each visit. Judging from our database, this is currently not a common occurrence (Table 1).
The algorithm predicts current/future risk of CKD, as opposed to IRIS staging that guides the clinician toward appropriate treatment decisions based on disease progression, a step that occurs following diagnosis of the disease. Organizations such as IRIS actively promote the importance of longitudinal health monitoring to detect kidney disease at an early stage, and we believe this approach strongly supports this message by highlighting the value in preventative care, not only supporting the earlier detection of CKD, but in time also presenting opportunities to proactively monitor a broader range of conditions that are diagnosed through routine clinical measures. Finally, we recognize that it is important to develop and validate care pathways based on the early prediction of CKD, for example, starting a specifically formulated diet to slow down or halt disease progression. We have initiated a clinical study to evaluate the benefits of early prediction‐based care pathways versus current best practices to assess whether intervention at the point the model identifies cats at risk of CKD improves clinical outcome. However, in the absence of data supporting the efficacy of interventions in cats with a positive prediction for CKD, it seems appropriate that IRIS staging guidance for treatment continues to be followed.
In conclusion, here we present evidence for the use of machine learning to build an algorithm that predicts cats at risk of developing CKD up to 2 years before diagnosis. The high specificity (>99%) of the algorithm, coupled with a sensitivity of 63.0%, means that out of 100 cats with a prevalence of 15%, 93 cases will be correctly predicted as either not being diagnosed or being diagnosed with CKD in the next 12 months. A particular strength of the current approach lies in the use of health screening data collected as part of routine veterinary practice, meaning that this model can be rapidly implemented into hospital practice or diagnostic laboratory software to directly support veterinarians in making clinical decisions.
CONFLICT OF INTEREST
Richard Bradley, Geert De Meyer, and Phillip Watson are employees of Mars Petcare. James Kennedy is an employee of Mars Incorporated.
Jonathan Elliott is in receipt of grant funding from IDEXX Laboratories Ltd and serves on their Advisory Board. He is also a board member of International Renal Interest Society (IRIS) that is supported by a grant from Elanco Animal Health. He has also acted as a consultant for Mars Petcare.
Ilias Tagkopoulos has been an advisor to the Mars Advanced Research Institute (MARI) and affiliated with PIPA LLC, which is a vendor to Mars, Inc.
OFF‐LABEL ANTIMICROBIAL DECLARATION
Authors declare no off‐label use of antimicrobials.
INSTITUTIONAL ANIMAL CARE AND USE COMMITTEE (IACUC) OR OTHER APPROVAL DECLARATION
Authors declare no IACUC or other approval was needed.
HUMAN ETHICS APPROVAL DECLARATION
Authors declare human ethics approval was not needed for this study.
Supporting information
Appendix S1: Supporting information
ACKNOWLEDGMENTS
We acknowledge Carina Salt, Richard Haydock, Emi Saito, Molly McAllister, Silke Kleinhenz, and the staff of Banfield Pet Hospitals for data science support and help with interpretation of 20 years of clinical data.
Bradley R, Tagkopoulos I, Kim M, et al. Predicting early risk of chronic kidney disease in cats using routine clinical laboratory tests and machine learning. J Vet Intern Med. 2019;33:2644–2656. 10.1111/jvim.15623
Funding information Mars, Incorporated
Richard Bradley and Ilias Tagkopoulos contributed equally to this study.
REFERENCES
- 1. O'Neill DG, Church DB, McGreevy PD, et al. Longevity and mortality of cats attending primary care veterinary practices in England. J Feline Med Surg. 2015;17:125‐133. [DOI] [PMC free article] [PubMed] [Google Scholar]
- 2. O'Neill DG, Church D, McGreevy PD, Thompson P, Brodbelt D. Prevalence of disorders recorded in cats attending primary‐care veterinary practice in England. Vet J. 2014;202:286‐291. [DOI] [PubMed] [Google Scholar]
- 3. Lulich JP, Osborne CA, O'Brien TD, Polzin DJ. Compendium on continuing education for the practising veterinarian. 1992;14:127. [Google Scholar]
- 4. Marino CL, Lascelles BD, Vaden SL, Gruen ME, Marks SL. Prevalence and classification of chronic kidney disease in cats randomly selected from four age groups and in cats recruited for degenerative joint disease studies. J Feline Med Surg. 2014;16(6):465‐472. [DOI] [PMC free article] [PubMed] [Google Scholar]
- 5. Brown CA, Elliott J, Schmiedt CW, Brown SA. Chronic kidney disease in aged cats: clinical features, morphology, and proposed pathogeneses. Vet Pathol. 2016;53(2):309‐326. [DOI] [PubMed] [Google Scholar]
- 6. Boyd LM, Langston C, Thompson K, Zivin K, Imanishi M. Survival in cats with naturally occurring chronic kidney disease (2000–2002). J Vet Intern Med. 2008;22:1111‐1117. [DOI] [PubMed] [Google Scholar]
- 7. Geddes RF, Finch NC, Elliott J, Syme HM. Fibroblast growth factor 23 in feline chronic kidney disease. J Vet Intern Med. 2013;27:234‐241. [DOI] [PubMed] [Google Scholar]
- 8. Syme HM, Markwell PJ, Pfeiffer D, Elliott J. Survival of cats with naturally occurring chronic renal failure is related to severity of proteinuria. J Vet Intern Med. 2006;20:528‐535. [DOI] [PubMed] [Google Scholar]
- 9. Levin A, Stevens PE. Early detection of CKD: the benefits, limitations and effects on prognosis. Nat Rev Nephrol. 2011;7(8):446‐457. [DOI] [PubMed] [Google Scholar]
- 10. Sparkes AH, Caney S, Chalhoub S, et al. ISFM consensus guidelines on the diagnosis and management of feline chronic kidney disease. J Feline Med Surg. 2016;18(3):219‐239. [DOI] [PMC free article] [PubMed] [Google Scholar]
- 11. Finch NC. Measurement of glomerular filtration rate in cats; methods and advantages over routine markers of renal function. J Feline Med Surg. 2014;16(9):736‐748. [DOI] [PMC free article] [PubMed] [Google Scholar]
- 12. Hall JA, Yerramilli M, obare E, et al. Comparison of serum concentrations of symmetric dimethylarginine and creatinine as kidney function biomarkers in cats with chronic kidney disease. J Vet Intern Med. 2014;28:1676‐1683. [DOI] [PMC free article] [PubMed] [Google Scholar]
- 13. Finch NC, Geddes RF, Syme HM, Elliott J. Fibroblast growth factor 23 (FGF‐23) concentrations in cats with early non azotemic chronic kidney disease (CKD) and in healthy geriatric cats. J Vet Intern Med. 2013;27:227‐233. [DOI] [PubMed] [Google Scholar]
- 14. Jepson RE, Brodbelt D, Vallance C, Syme HM, Elliott J. Evaluation of the predictors of azotemia in cats. J Vet Intern Med. 2009;23:806‐813. [DOI] [PubMed] [Google Scholar]
- 15. Parikh RB, Kakad M, Bates DW. 2016. Integrating predictive analytics into high‐value care: the dawn of precision delivery. JAMA 2016;315(7):651–652 [DOI] [PubMed] [Google Scholar]
- 16. Peck JS, Benneyan JC, Nightingale DJ, Gaehde SA. Predicting emergency department inpatient admissions to improve same‐day patient flow. Acad Emerg Med. 2012;19:E1045E1054. [DOI] [PubMed] [Google Scholar]
- 17. Peck JS, Gaehde SA, Nightingale DJ, et al. Generalizability of a simple approach for predicting hospital admission from an emergency department. Acad Emerg Med. 2013;20:11561163. [DOI] [PubMed] [Google Scholar]
- 18.Gultepe, Eren, et al. From vital signs to clinical outcomes for patients with sepsis: a machine learning basis for a clinical decision support system. J Am Med Inform Assoc 2013;212:315–325. [DOI] [PMC free article] [PubMed] [Google Scholar]
- 19. Tsoukalas A, Albertson T, Tagkopoulos I. From data to optimal decision making: a data‐driven, probabilistic machine learning approach to decision support for patients with sepsis. JMIR Med Inform. 2015. Feb 24;3(1):e11. [DOI] [PMC free article] [PubMed] [Google Scholar]
- 20. Callahan A, Shah NH. Machine Learning in Healthcare Key Advances in Clinical Informatics. Academic Press: Cambridge, MA; 2018:279‐291. [Google Scholar]
- 21. Pencina MJ, Peterson ED. Moving from clinical trials to precision medicine: the role for predictive modelling. JAMA. 2016;315:17131714. [DOI] [PubMed] [Google Scholar]
- 22. Perez L, Wang J. The Effectiveness of Data Augmentation in Image Classification using Deep Learning. 2017; arXiv:1712.04621. https://arxiv.org/abs/1712.04621
- 23. Tang J, Alelyani S, Liu H. Feature selection for classification: a review Data Classification: Algorithms and Applications. CRC press: Boca Raton, Florida; 2014. [Google Scholar]
- 24. Goodfellow I, Bengio Y, Courville A. Deep Learning. MIT Press: Cambridge, MA; 2016. [Google Scholar]
- 25. Salvador S, Chan P. FastDTW: toward accurate dynamic time warping in linear time and space. Intell Data Anal. 2007;11(5):561‐580. [Google Scholar]
- 26. Gulli A, Pal S. Deep Learning with Keras. Packt Publishing: Birmingham, UK; 2017. [Google Scholar]
- 27. Srivastava N, Hinton G, Krizhevsky A, Sutskever I, Salakhutdinov R. Dropout: a simple way to prevent neural networks from overfitting. J Mach Learn Res. 2014;15:1929‐1958. [Google Scholar]
- 28. Powers DMW. Evaluation: from precision, recall and F‐measure to ROC, informedness, markedness & correlation (PDF). J Mach Learn Technol. 2011;2(1):37‐63. [Google Scholar]
- 29. R Core Team . R: A Language and Environment for Statistical Computing. R Foundation for Statistical Computing, Vienna, Austria: 2017. https://www.R-project.org/. [Google Scholar]
- 30. Stekhoven D, Bühlmann P. MissForest—nonparametric missing value imputation for mixed‐type data. Bioinformatics. 2012;28:112‐118. [DOI] [PubMed] [Google Scholar]
- 31. Elliott J, Fletcher M, Syme HM. Idiopathic feline hypertension: epidemiological study. J Vet Intern Med. 2003;17:754. [Google Scholar]
- 32. Conroy M, Chang YM, Brodbelt D, Elliott J. Survival after diagnosis of hypertension in cats attending primary care practice in the United Kingdom. J Vet Intern Med. 2018;32(6):1846‐1855. [DOI] [PMC free article] [PubMed] [Google Scholar]
- 33. Braff J, Obare E, Yerramilli M, Elliott J, Yerramilli M. Relationship between serum symmetric dimethylarginine concentration and glomerular filtration rate in cats. J Vet Intern Med. 2014;28:1699‐1701. [DOI] [PMC free article] [PubMed] [Google Scholar]
Associated Data
This section collects any data citations, data availability statements, or supplementary materials included in this article.
Supplementary Materials
Appendix S1: Supporting information


