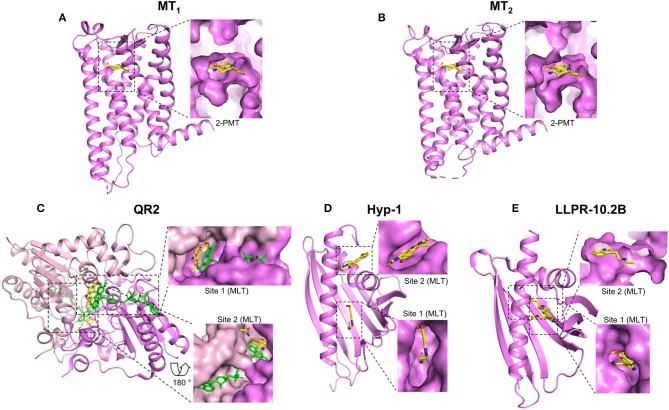
Figure 1.
Crystal structures of melatonin target proteins in complex with melatonin or close derivatives. The full scales of the proteins are shown in cartoon in violet and the bound ligands in yellow. The ligand binding sites are highlighted by dashed rectangles and the details are shown aside by enlarged surface areas of the proteins. For those located inside, sliced views are shown to visualize the ligand. (A) MT1: MT1 receptor, PDB 6ME3; (B) MT2: MT2 receptor, PDB 6ME6; (C) QR2: Quinone reductase 2, PDB 2QWX, the second monomer is in light pink; FAD cofactors are shown in green (D) Hyp-1: St. John's wort Hyp-1 protein, PDB 5I8F; (E) LLPR-10.2B: Yellow lupin LLPR-10.2B protein, PDB 5MXB. MLT: Melatonin; 2-PMT: 2-phenylmelatonin. Structural views were generated using the PyMOL Molecular Graphics System (Schrodinger LLC), based on available information from the references mentioned in the text.

