
Figure 2.
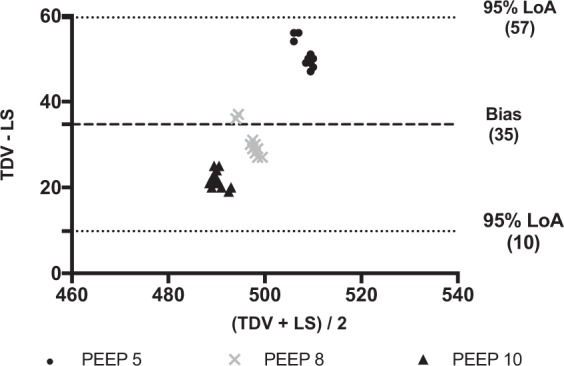
Bland-Altman plot of the differences between tidal volumes measured by the turbine driven ventilator and the lung simulator in the normal condition. Data are reported in ml. PEEP: Positive end expiratory pressure (values are expressed in cmH2O). TDV: Tidal volume (VT) measured by turbine driven ventilator; LS: Tidal volume (VT) measured by lung simulator. Average (x-axys): average of the two measurements; TDV – LS (y-axys): difference between mesurements. Bias: Average of the differences between measurements. 95% LoA: Limits of agreement (±1.96 standard deviation - SD - of the bias). All plotted differences are within the 95% LoA. In this plot, the overall bias is 35 ml, and 95% LoA are from 10 to 57 ml. It reaches the least clinical relevance at PEEP 10 cmH2O.