Figure 4.
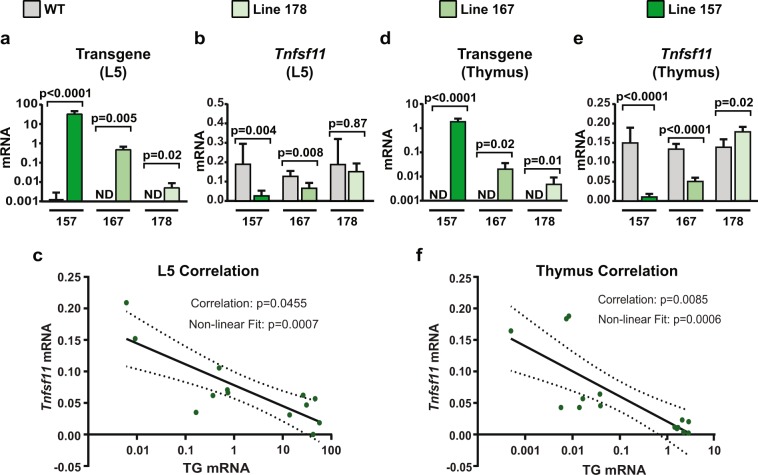
RNA expression in CRISPRi mouse lines. (a) Quantitative RT-qPCR analysis of transgene mRNA in L5 vertebrae from 5-week-old mice of line 157 WT (n = 6) and TG (n = 6), line 167 WT (n = 4) and TG (n = 5), and line 178 WT (n = 6) and TG (n = 3). Both sexes were included. Transgenic compared to WT littermates of the same line using Student’s t test. (b) Quantitative RT-qPCR analysis of Tnfsf11 mRNA in L5 vertebrae from 5-week-old mice of line 157 WT (n = 6) and TG (n = 6), line 167 WT (n = 4) and TG (n = 5), and line 178 WT (n = 6) and TG (n = 3). Both sexes were included. Transgenic compared to WT littermates of the same line using Student’s t test. (c) Correlation analysis of the values shown in a and b. Correlation significance and line of best fit included. (d) Quantitative RT-qPCR analysis of transgene mRNA in thymus from 5-week-old mice of line 157 WT (n = 6) and TG (n = 7), line 167 WT (n = 4) and TG (n = 5), and line 178 WT (n = 5) and TG (n = 3). Both sexes were included Transgenics compared to WT littermates of the same line using Student’s t test. (e) Quantitative RT-qPCR analysis of Tnfsf11 mRNA in thymus from 5-week-old mice of line 157 WT (n = 6) and TG (n = 7), line 167 WT (n = 4) and TG (n = 5), and line 178 WT (n = 5) and TG (n = 3). Both sexes were included. Transgenic compared to WT littermates of the same line using Student’s t test. (f) Correlation analysis of the values shown in (d,e). Correlation significance and line of best fit included.

