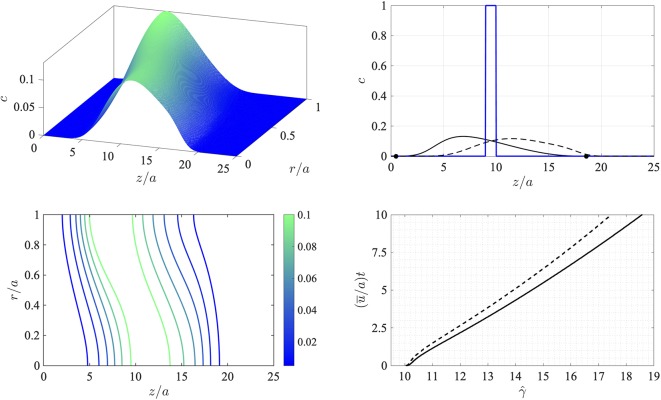
Figure 2.
Numerical simulation of the advection-diffusion problem (8)-(10) in a reference frame moving at the average flow speed u¯. Top left: surface concentration plot at (u¯/a)t = 10. Bottom left: concentration contours at (u¯/a)t = 10. The Péclet number is Pe = a u¯/D = 30.0. Top right: wall concentration c(z,a,t) (solid line) and centerline concentration c(z,0,t) (dashed line) at time (u¯/a)t = 10 shown against dimensionless distance z/a (the initial condition at t = 0 is indicated by the thick solid line). The location of the leading and rearward critical points at (u¯/a)t = 10 are shown with filled circles. Bottom right: the trajectory of the downstream-moving critical point in the moving frame for the threshold concentration σ = 10–4 (solid line) and σ = 10–4 (dashed line).

