Fig. 2.
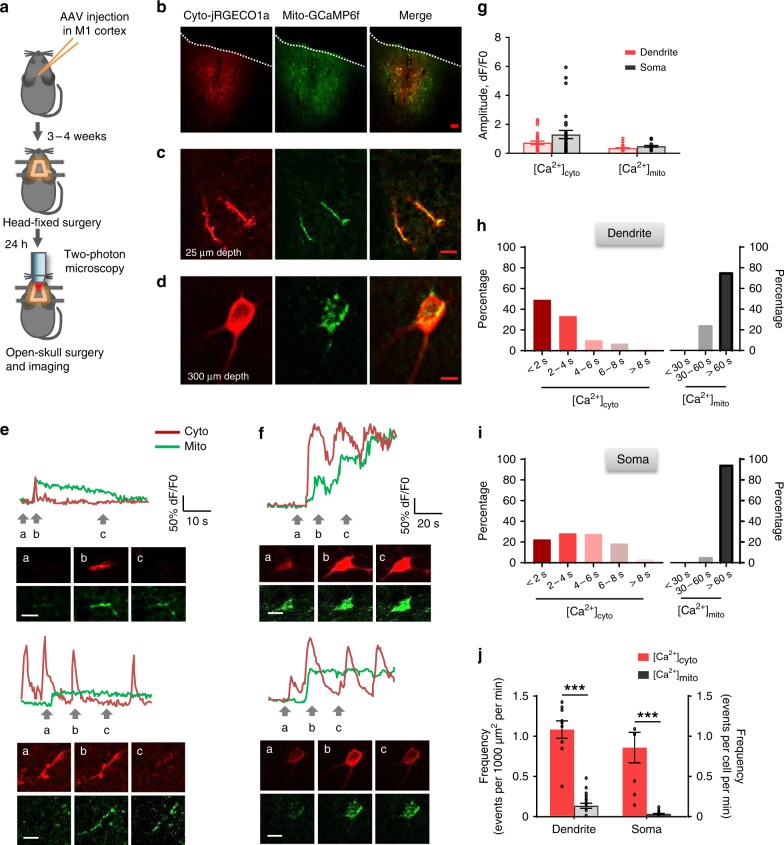
Imaging of [Ca2+]cyto and [Ca2+]mito transients in cortical neurons in awake mice. a Schematic showing experimental timeline for virus injection, head holder mounting, open-skull surgery, and two-photon imaging. Genetically-encoded Ca2+ indicators, mito-GCaMP6f and jRGECO1a, were used to report cytosolic and mitochondrial Ca2+ activity, respectively. b Confocal imaging of primary motor cortex neurons labeled by mtGCaMP6f and jRGECO1a in brain slice. Most of the labeled cells were in L2/3 (~150–350 μm deep from pial). Scale bars: 50 μm. c, d Representative 2PM images of double labeling of L1 dendrites at 25 μm depth (c) and a L2/3 soma at 300 μm depth (d). Scale bars: 20 μm. e, f Representative examples of pairs of [Ca2+]cyto and [Ca2+]mito transients in L1 dendrites (e) and L2/3 somas (f). Upper panels: time courses of fluorescence changes. Lower panels: corresponding dual channel images at three time points marked by arrows. Note that [Ca2+]mito transients display highly variable kinetics that can be mostly categorized into regular (upper panel of e), plateaued (lower panels), and staircase groups (upper panel of f). Scale bars: 10 μm (e) and 20 μm (f). g Amplitudes of [Ca2+]cyto and [Ca2+]mito transients in dendrites (n = 29 [Ca2+]cyto events and n = 29 [Ca2+]mito events from 6 mice) and somas (n = 29 [Ca2+]cyto events and n = 22 [Ca2+]mito events from 8 mice). h, i Distribution of duration of [Ca2+]cyto and [Ca2+]mito transients in dendrites (h) and somas (i) (h: n = 6 mice; i: n = 8 mice.). j Frequencies of spontaneous [Ca2+]cyto and [Ca2+]mito transients in dendrites (n = 9 [Ca2+]cyto events and n = 21 [Ca2+]mito events from 6 mice) and somas (n = 8 [Ca2+]cyto events and n = 25 [Ca2+]mito events from 8 mice). Data are presented as mean ± SEM. *P < 0.05. **P < 0.01. ***P < 0.0001, unpaired T-test. Source data are provided as a Source Data file.

