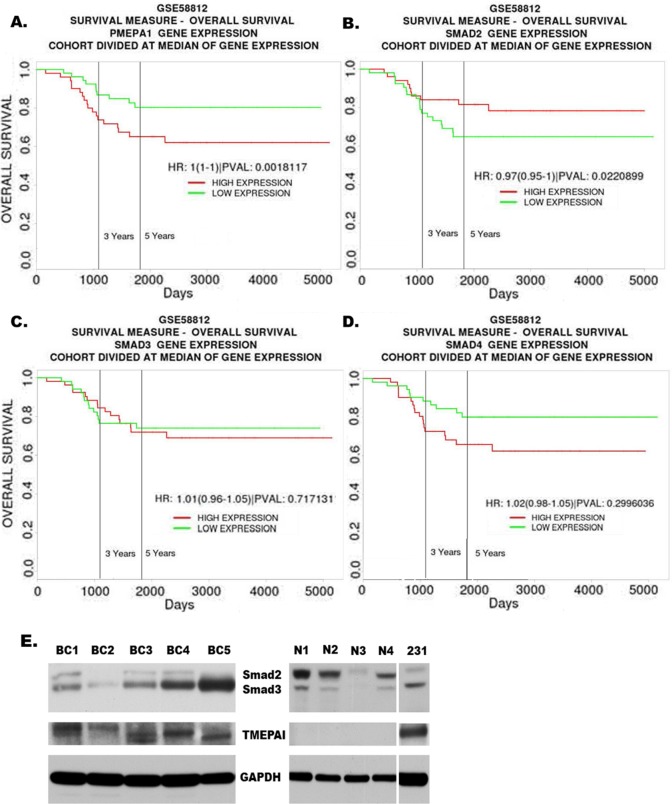
Figure 7. High Expression of TMEPAI/PMEPA1 and low expression of Smad2 are associated with poor prognosis of TNBC patients.
Kaplan Meier curves for overall survival of triple negative breast cancer patients in relation to expression of TMEPAI/PMEPA1 (A), Smad2 (B), Smad3 (C) or Smad4 (D) mRNA using a publicly accessible database (GSE58812). E. Western blots of TMEPAI and total Smad2/3 proteins in primary tumors from human breast cancer patients (BC1- BC5) and corresponding normal/benign (N1-N4) samples relative to MDA-MB-231 cells (231).

