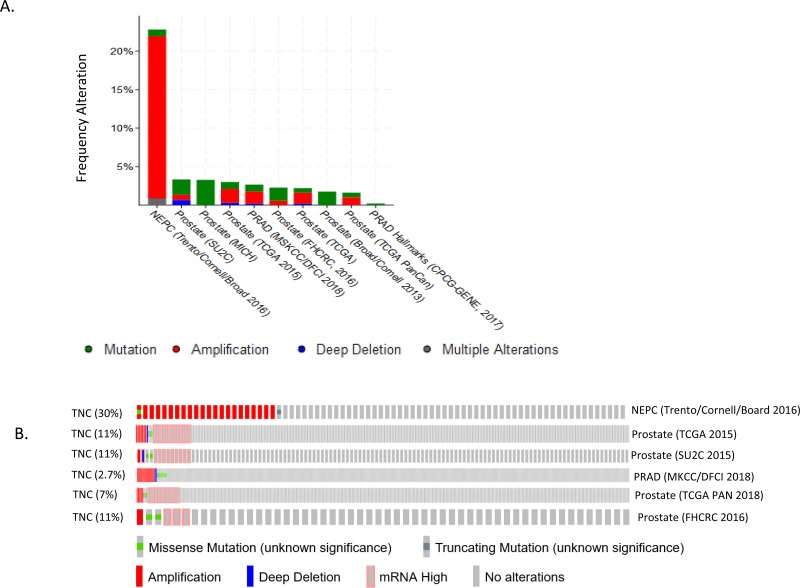
Figure 1. TNC is altered in neuroendocrine prostate cancer tissues.
A. Percentage of alteration frequency of TNC in form of somatic mutation (green), gene amplification (red), deep deletion (blue), multiple alterations (grey) represented across datasets of prostate cancer, present in c-bioportal. B. OncoPrint representing the query for TNC across six datasets, as described in the figure. Each row represents oncoprint for the queried gene in a separate prostate cancer dataset. Alteration frequency for the gene is represented in percentage. The rectangular boxes for each dataset oncoprint, represents a patient sample/case. Genetic alterations are color coded: Amplification, red; Gain of function (mRNA High), Pink; Missense mutations, green; Deep deletion, blue; No alterations, grey.

