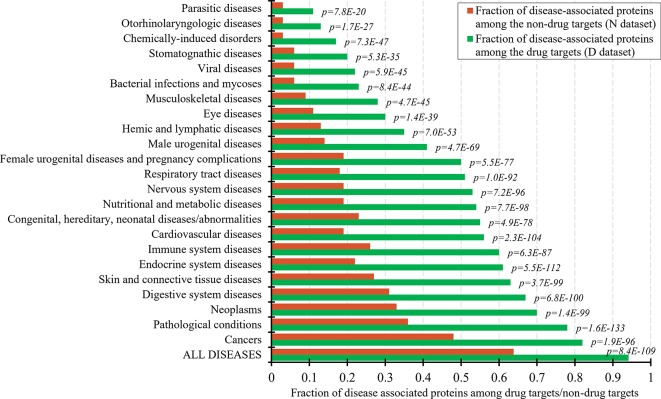
Figure 1.
Fraction of drug targets and non-drug targets associated with different classes of diseases. The green and red bars show the fraction of disease associated proteins among the drug targets and non-drug targets for each disease class. The p-values quantify the significance of the differences between the two fractions using the Fisher’s exact test. The disease classes are sorted by the value of the fraction of the drug targets.

