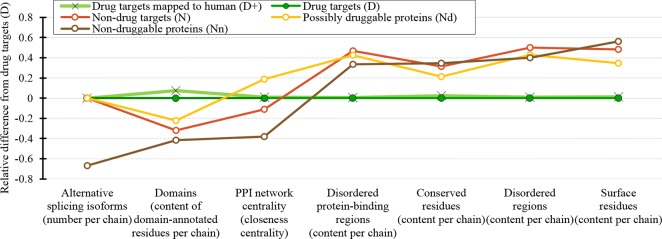
Figure 10.
Overview of the sequence-derived markers for the drug targets (D), all human and human-like targets (D+), non-drug targets (N), possibly druggable proteins (Nd), and non-druggable proteins (Nn). The y-axis quantifies the relative difference of the values of a given protein set X compared to the values of the drug targets (D) set defined as: [median(X)-median(D))/IQR(D), where IQR means the interquartile range. The markers are sorted in the ascending order by the difference for the non-druggable proteins (in brown).

