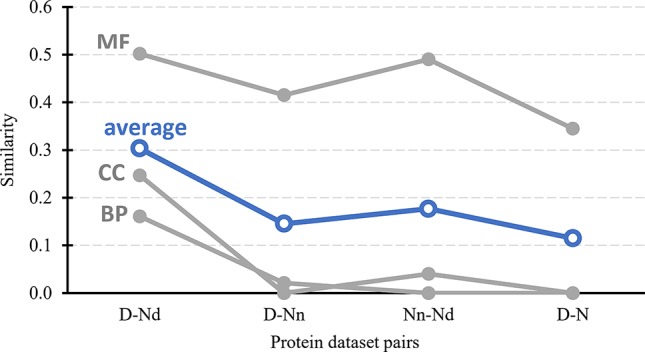
Figure 3.

Similarity in cellular processes and subcellular locations between the drug targets (D dataset), possibly druggable proteins (Nd dataset), non-druggable proteins (Nn dataset), and non-drug targets (N dataset). We measure similarity for four pairs of these datasets (D vs. Nd, D vs. Nn, D vs. N, and Nn vs. Nd) based on the comparison of the corresponding sets of GO terms associated with these datasets, i.e., GO terms over-represented in a given dataset when compared to the entire human proteome. The GO terms are divided into three categories: MF (molecular functions), BP (biological processes), and CC (cellular components). Similarity was measured with the GOSemSim package (Li et al., 2010). We describe details of these calculations in section “Statistical and similarity analyses”. The gray markers show the similarity for each GO-term category while the blue markers are the average across the three categories.
