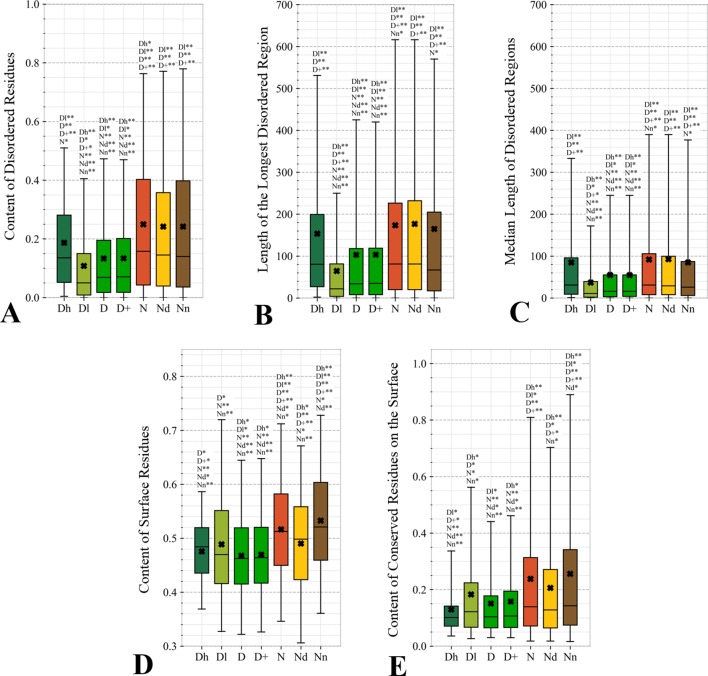
Figure 5.
Distributions of the values of the sequence-derived structural characteristics predicted from the protein sequence for the highly promiscuous drug targets (Dh), drug targets that interact with a low number of drugs (Dl), all drug targets (D), all human and human-like targets (D+), non-drug targets (N), possibly druggable proteins (Nd), and non-druggable proteins (Nn). Panels A, B, and C quantify the abundance of intrinsic disorder while Panels D and E quantify the amount of surface and the amount of conserved residues on the surface, respectively. The whiskers show the 5 and 95 percentiles, the top and bottom of the box correspond to the first and third quartiles, the middle bar is the median, and the cross marker is the average. The annotation above the whiskers show the significance of differences with the other protein sets; only significant differences are listed where N* means p-value 0.05 and N** means p-value 0.0001 when compared with the N dataset. We explain calculation of statistical tests in section “Statistical and similarity analyses”.

