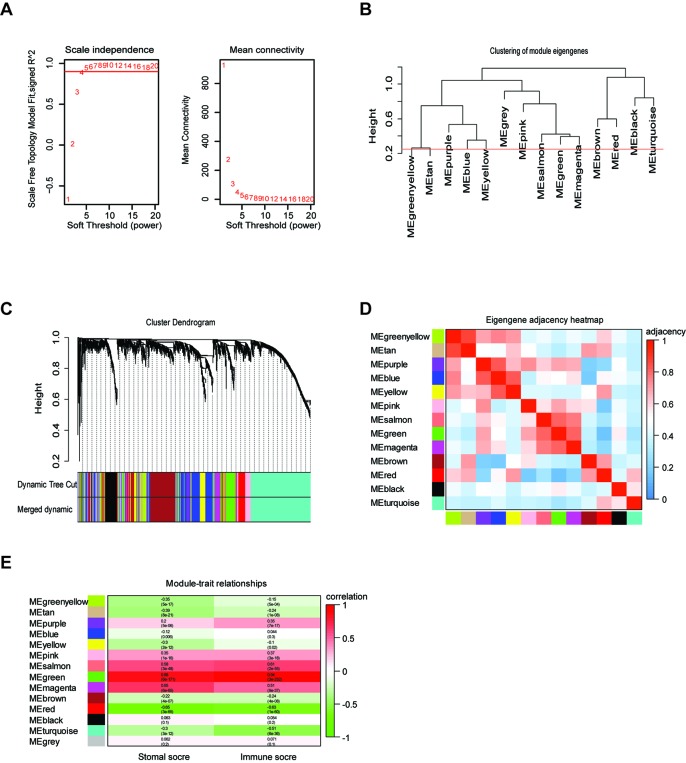
Figure 2.
Weighted gene co-expression network of LrGG. (A) Analysis of network topology for various soft-thresholding powers and identification of suit soft -thresholding power to construct a scale-free network. (B) Clustering dendrogram of consensus module eigengenes. The red line represents merging threshold and modules with a correlation coefficient more than 0.75 were merged. (C) Hierarchical cluster analysis dendrogram used to detect co-expression models along with corresponding color assignments in LrGG. (D) The eigengene adjacency heatmap of 13 co-expression models. The eigengene adjacency AIJ = (1 + cor (EI, EJ))/2. The table is color-coded by adjacency according to the color legend, which decreased in size from red to blue. (E) Correlation between the gene modules and immune scores as well as stromal score. Rows correspond to module eigengenes, columns correspond to traits. Each cell contains the corresponding correlation and p-value. The table is color-coded by correlation according to the color legend, which decreased in size from red to green.

