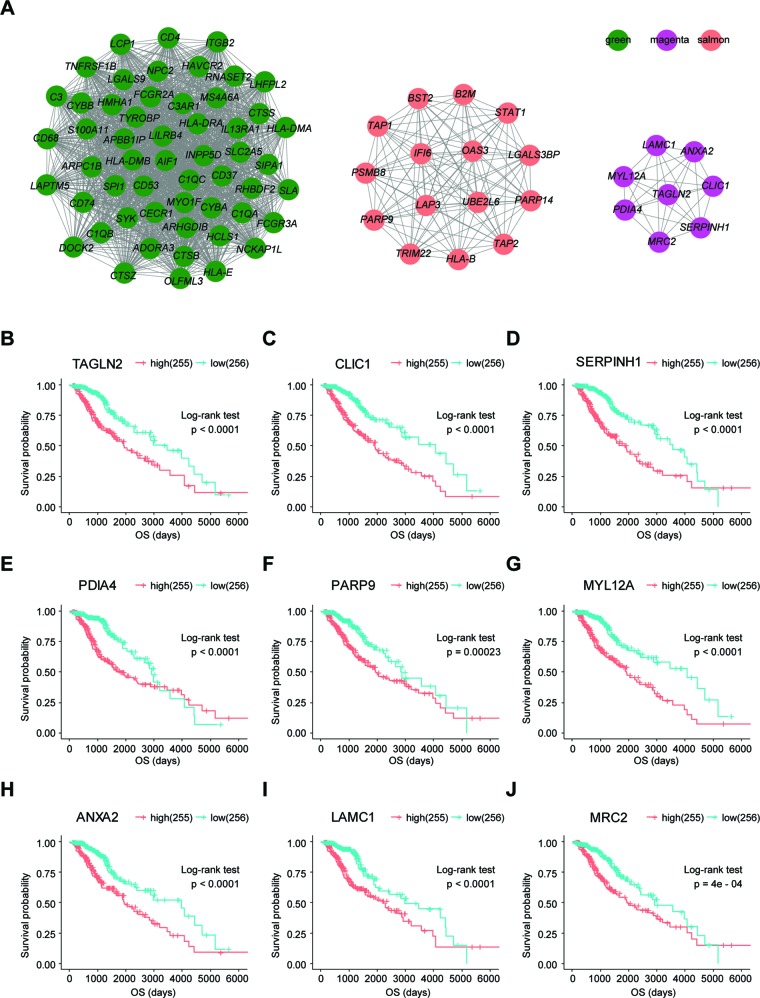
Figure 3.
Visualization of hub genes in three modules and Kaplan-Meier survival curves of the top nine prognostic genes. (A) Visualization of hub genes in the green, magenta, and salmon modules, respectively, based on weight. (B–J) Kaplan-Meier survival curves for the top nine prognostic genes ranked by p value from small to large (grouped by median value of the gene expression level).

