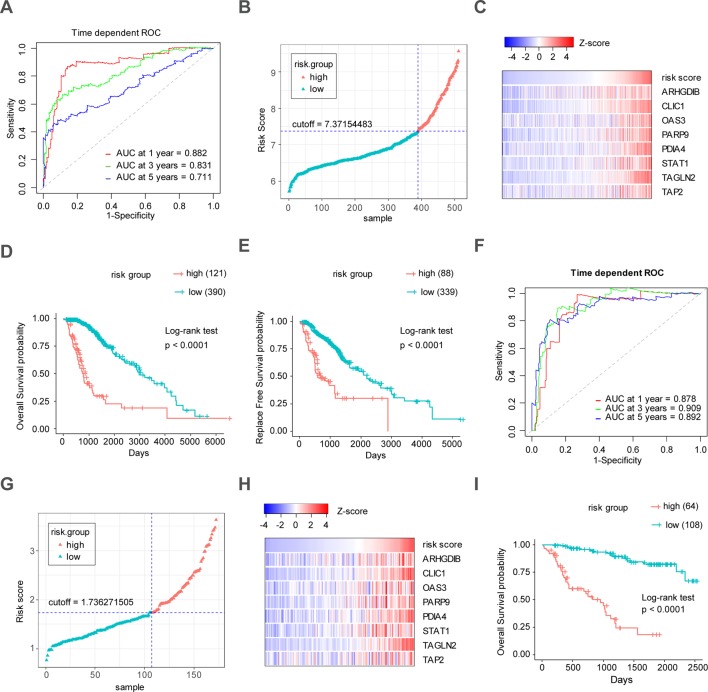
Figure 6.
Construction and validation of the eight-gene prognostic model in LrGG cohorts. (A) Time-dependent ROC curves indicated good performance of the eight-gene prognostic model in the TCGA cohort. (B) The distribution of risk scores in TCGA cohort. (C) Heatmap of the model genes in TCGA dataset; the expression of eight genes was transformed by the z-score. (D) Kaplan-Meier curve for OS in TCGA LrGG cohort stratified by the eight-gene model as high- and low-risk. (E) Kaplan-Meier curve for RFS in TCGA LrGG cohort stratified by the eight-gene model into high- and low-risk. (F) Time-dependent ROC curves indicated good performance of our prognostic model in the CGGA cohort. (G) The distribution of risk scores in the CGGA cohort. (H) Heatmap of the model genes in the CGGA dataset; the expression of eight genes was transformed by the z-score. (I) Kaplan-Meier curve for OS in the CGGA LrGG cohort stratified by the eight-gene model into high- and low-risk.

