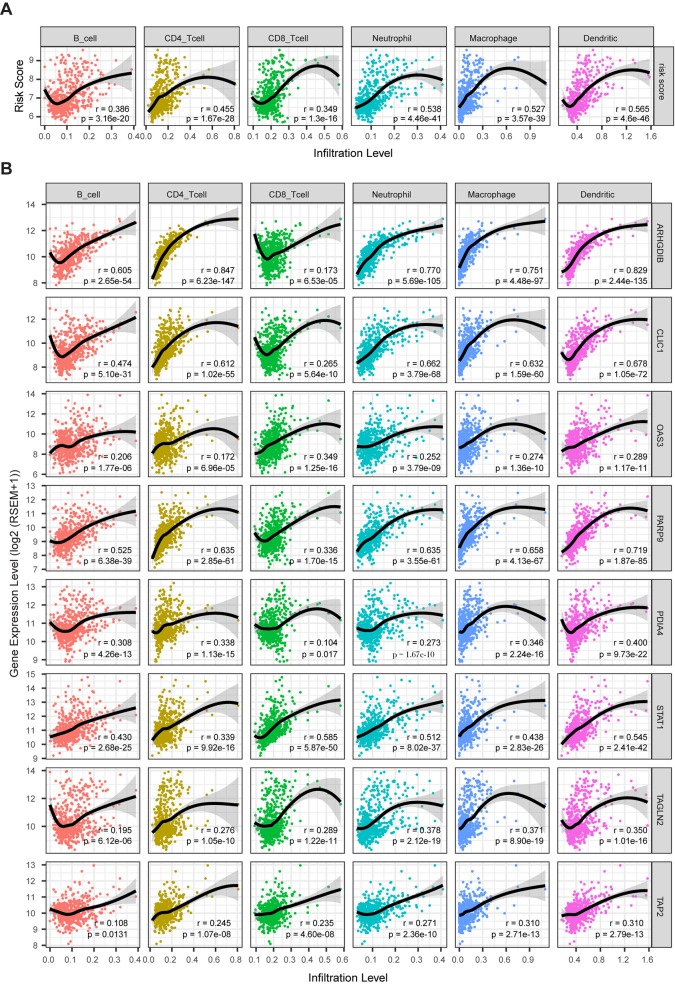
Figure 9.
The correlation between model genes as well as risk score and infiltration level of immune cells (Spearman’s r and p, smoother is LOESS, and confidence band is SE). (A) The risk score significantly associated with infiltrating levels of immune cells. (B) ARHGD1B, CLIC1, OAS3, PARP9, PDIA4, STAT1, TAGLN2, and TAP2 were significantly correlated with infiltrating levels of immune cells.

