
Fig. 2.
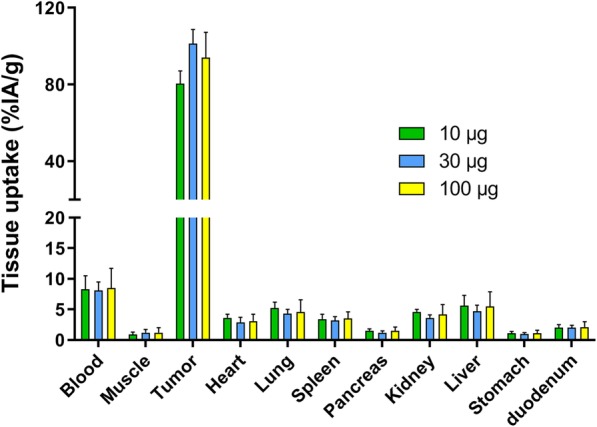
Biodistribution of 10 μg (n = 5, green), 30 μg (n = 5, blue), and 100 μg (n = 4, yellow) dual-labeled trastuzumab in mice with orthotopic BT474 tumors 48 h after administration. Tumor uptake after injection of 30 μg [111In]In-DTPA-trastuzumab-IRDye800CW was the highest %IA/g, while there was no significant difference to the 10 and 100 μg dose levels. Tissue uptake is expressed as %IA/g. Values represent mean ± SD