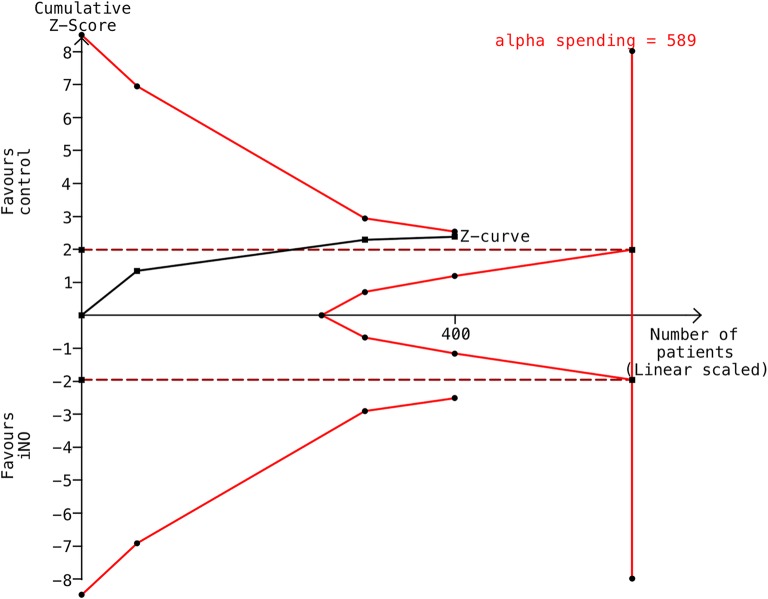
Fig. 5.
Trial sequential analysis (TSA) for the primary outcome. The TSA of the included trials (black square fill icons) shows that the cumulative Z curve did cross the traditional boundary (wine red dotted line) but did not cross the trial sequential monitoring boundary (red full line) for futility or reach the required information size (n = 589). X-axis: the number of patients randomized; y-axis: the cumulative z score; horizontal wine red dotted lines: conventional boundaries (upper for benefit, z score = 1.96, lower for harm, z score = − 1.96, two-sided, p = 0.05); oblique red lines with black full circle icons: trial sequential monitoring boundaries; oblique black line with black full square icons: Z curve; and vertical red straight line with circles: required information size. The diversity-adjusted required information size (589 participants) was based on a relative risk reduction of 30%, an alpha of 5%, a beta of 20%, and an event proportion of 50.7% in the control arm. The red cumulative Z curve was constructed using a random-effects model with the DerSimonian–Laird Method

