Fig. 1.
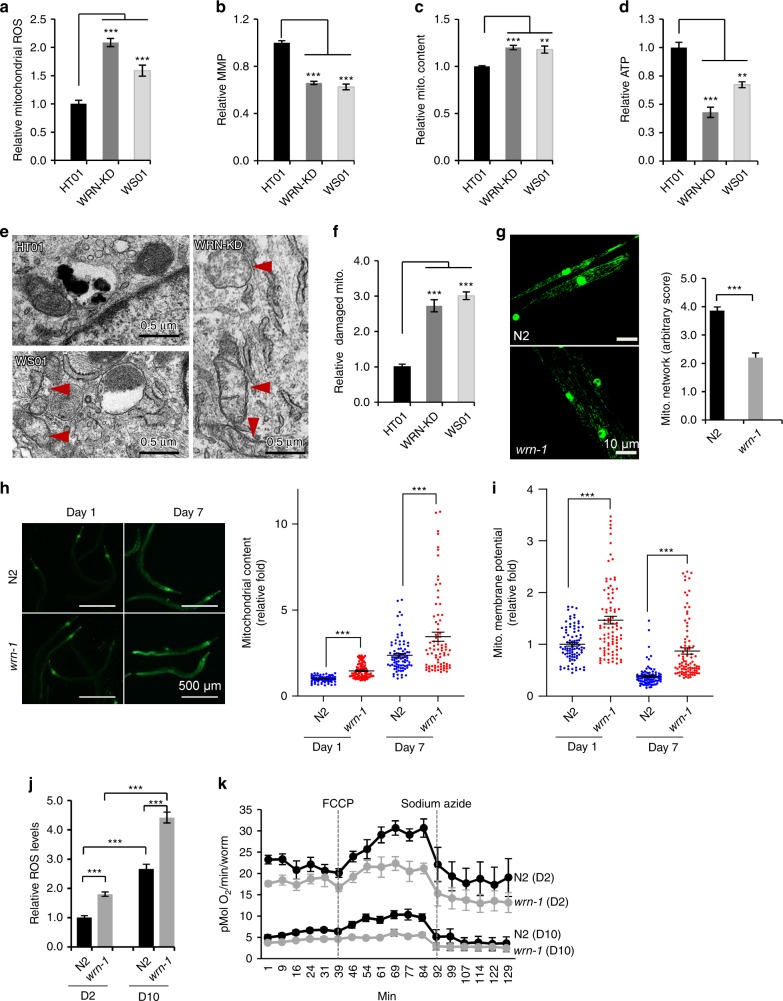
Mitochondrial dysfunction and NAD+ reduction in WS human cells and C. elegans. (a–c) Flow cytometry was used to quantify relative mitochondrial ROS (a, mitoSOX), mitochondrial membrane potential (b, TMRM), and mitochondrial content (c, MitoTracker Green). n = 3 biologically independent experiments (One-way ANOVA). d Cellular ATP levels. n = 3 biologically independent experiments (One-way ANOVA). e, f Changes of mitochondrial ultrastructure were evaluated through electron microscopy (e) and damaged mitochondria quantified (f). (n = 100 mitochondria from three independent samples; One-way ANOVA). Red arrows denote damaged mitochondria. g A myo-3::gfp reporter was expressed in both nucleus and mitochondria to mark non-pharyngeal body wall muscle cells in worms. Representative images and quantified scores of muscle mitochondrial morphology of adult D2 N2 and wrn-1(gk99) worms. Data are shown in mean ± S.E.M (n = 20 worms; Student t-test). h Increased organismal mitochondrial content in the WS worms. MitoTracker Green was used for organismal mitochondrial staining. A set of representative images (Scale bar, 500 µm) is shown with quantified data in mean ± S.E.M. with values pooled from three independent biological repeats (n = 80 worms; Two-way ANOVA). i Upregulated mitochondrial membrane potential (MMP) in the WS worms. Data are shown in mean ± S.E.M. with values pooled from three independent biological repeats (n = 90 worms; Two-way ANOVA). j Relative levels of ROS in adult D2 and D10 worms. (n = 10 worms/group; Two-way ANOVA). k OCR in adult D2 and D10 worms (n = 15 worms/well, three biological repeats with quantified data). Data are shown in mean ± S.E.M. *p < 0.05, **p < 0.01, ***p < 0.001.

