Fig. 2.
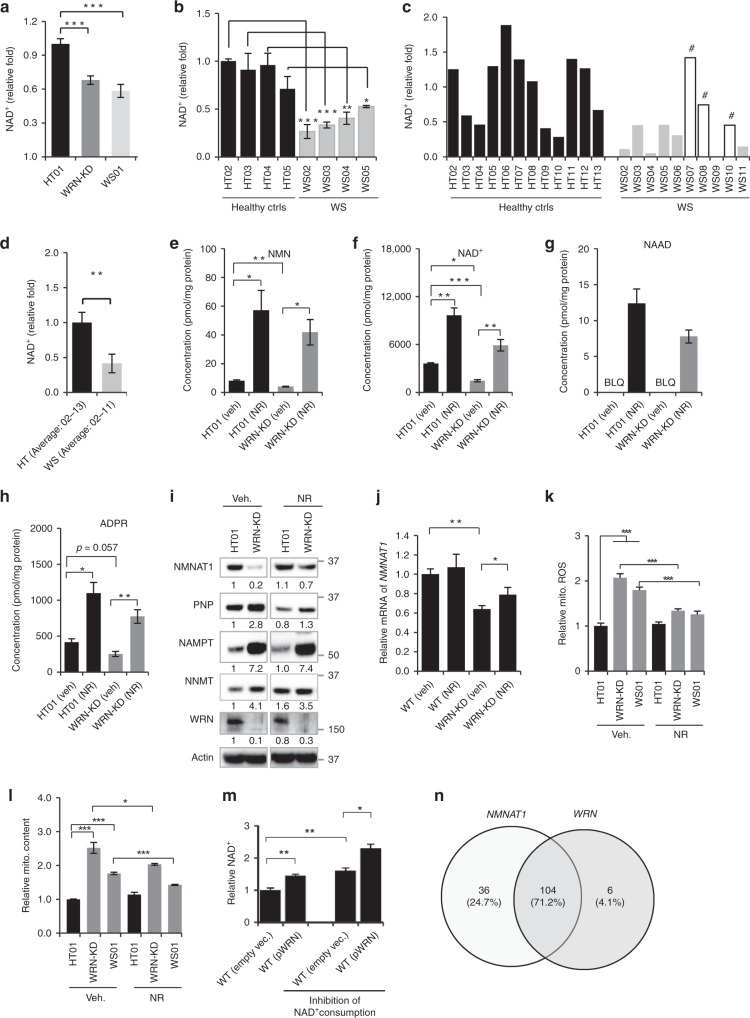
Impaired NAD+-generating machinery in human WS cells. a, b Relative NAD+ levels in human WS patient cells and controls. Data, mean ± S.E.M (n = 3 biologically independent experiments; One-way ANOVA). c, d Relative NAD+ levels in blood samples from human WS patients and controls. Data of d were mean ± S.E.M from all samples of c. #, samples from WS patients without obesity (also see Supplementary Table 2). One-way ANOVA or Student t-test was used for data analysis (e–h) LC-MS data showing changes of NMN (e), NAD+ (f), NAAD (g), and ADPR (h) in HT01 and WRN-KD cells before and after NR treatment (1 mM, 24 h). (n = 3 biologically independent experiments) (One-way ANOVA). i WRN regulates NMNAT1 at protein level. Source data are provided as a Source Data file. j WRN regulates NMNAT1 at transcriptional level. mRNA levels of NMNAT1 in different conditions were measured using real-time PCR. Data are shown in mean ± S.E.M (n = 3 biologically independent experiments; One-way ANOVA). k, l Effect of NR (1 mM, 24 h) on the relative levels of mitochondrial ROS (mitoSOX dye) and mitochondrial content (mitoGreen dye) of the designated cells. Data are shown in mean ± S.E.M (n = 3 biologically independent experiments; One-way ANOVA). m Relative NAD+ levels in WT or WRN-overexpressing cells. Data are shown in mean ± S.E.M (n = 3 biologically independent experiments; One-way ANOVA). n Venn diagram with transcription factors that bind the genes respective promoters of NMNAT1 and WRN in ChIP-seq datasets from the ENCODE Transcription factor target datasets. Data are shown in mean ± S.E.M. *p < 0.05, **p < 0.01, ***p < 0.001.

