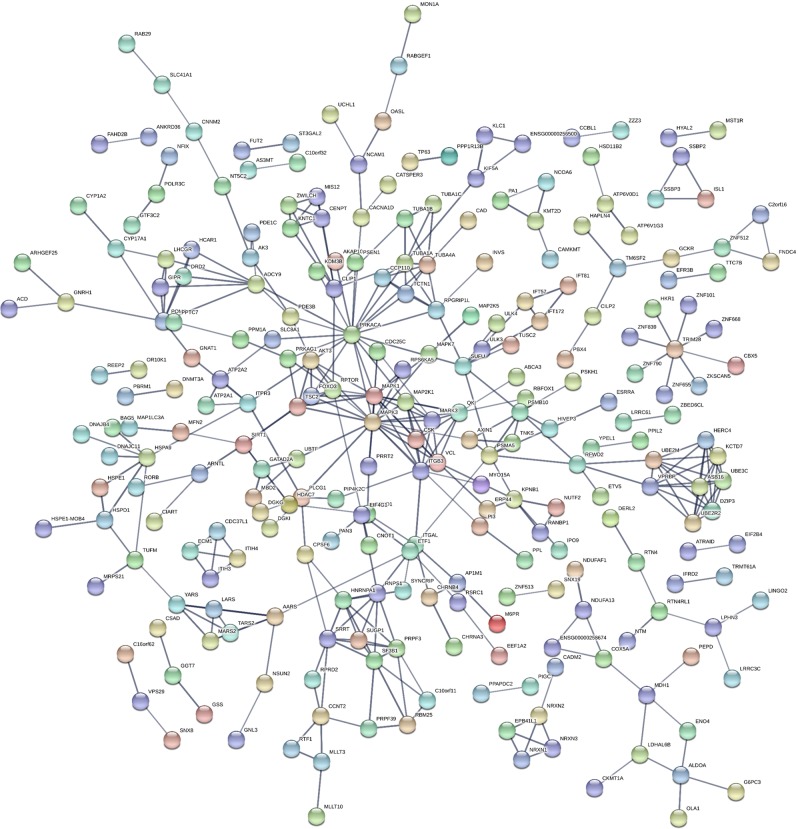
Fig. 1. Predicted interactions between proteins encoded by genes commonly associated to bipolar disorder and BMI.
Output of the protein–protein interaction analysis conducted using STRING with genes associated with bipolar disorder and BMI as input. Each node represents all the proteins produced by a single protein-coding gene locus (splice isoforms are collapsed), while edges represent protein–protein associations. The interaction score was set to high confidence (score = 0.7) and all the active interaction sources supported by the tool were included (text mining, experiments, databases, co-expression, neighborhood, gene fusion and co-occurrence). The network of proteins encoded by genes commonly associated with bipolar disorder and BMI presents more interactions compared to the number expected for a random set of proteins of similar size extracted from the genome (number of nodes: 504, expected number of edges: 332, observed number of edges: 392, protein–protein interaction enrichment p = 0.0007).

