Fig. 5.
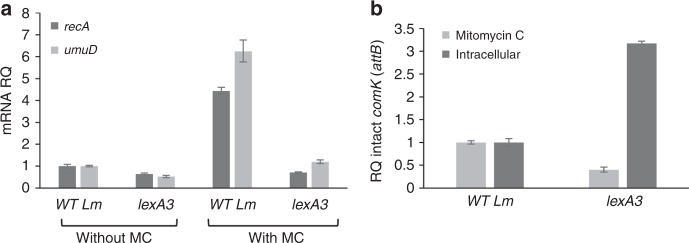
The role of the SOS response in MpaR activation. a qRT-PCR transcription analysis of SOS response representative genes (recA and umuD) in WT bacteria and bacteria harboring lexA3 mutation, with and without MC treatment at 30 ˚C. Transcription levels are presented as relative quantity (RQ), relative to their levels in untreated WT bacteria. The data represents three independent experiments. Error bars indicate a 95% confidence interval. b qRT-PCR transcription analysis of intact comK gene (attB site) in WT bacteria and bacteria harboring the lexA3 mutation upon MC treatment or during intracellular growth in macrophages (6 h post infection). attB levels are presented as relative quantity (RQ), relative to their levels in WT bacteria. The data represents three independent experiments. Error bars indicate a 95% confidence interval. Source data are provided as a Source Data file.

