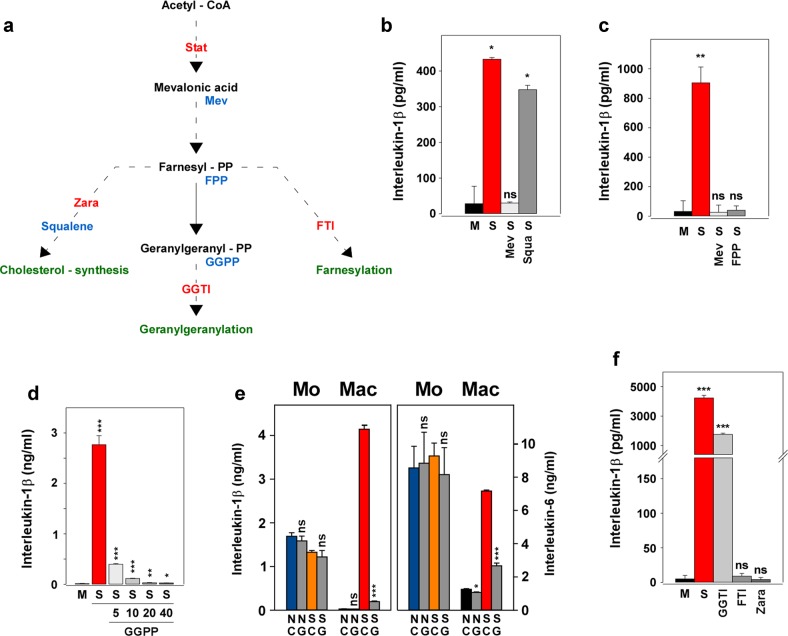
Fig. 2. The isoprenoid pathway, rather than cholesterol synthesis, is involved in the retainment effect.
a Schematic overview of the cholesterol and isoprenoid pathways, as well as the used inhibitors and reconstituting compounds. Red letters, the used inhibitors. Blue letters, the compounds used for reconstitution/spiking. Green letters, the respective pathway. The broken lines indicate omission of steps. FPP, farnesyl pyrophosphate; FTI, farnesyl transferase inhibitor; GGPP, geranylgeranyl pyrophosphate; GGTI, geranylgeranyl transferase inhibitor; Mev, mevalonic acid; Stat, statin; Zara, zaragozic acid A. b Mevalonic acid, but not squalene, reverses the retainment effect. Mac (50,000 cells/cm2; 24-well plate) were incubated as outlined in Fig. 1a. The cells were preincubated during day 1 with medium (M; black column), statin (S; red column), statin plus mevalonic acid (S Mev; light gray column; 10 µM; Sigma-Aldrich) or statin plus squalene (S Squa; dark gray column; 20 µM; Sigma-Aldrich). On day 2, LPS was added to all cultures and the supernatants were harvested 24 h later. Two experiments with similar results were performed. Data analysis and color code as in Fig. 1c (“M” vs. “S”, “S Mev” or “S Squal”, respectively). c FPP, like mevalonic acid, reverses the retainment effect. Experimental design as in Fig. 2b, except for the use of farnesyl pyrophosphate (S FPP, 20 µM; Echelon Biosciences, Mobitec, Göttingen, Germany). Two experiments with similar results were performed. Data analysis and color code as in Fig. 1c (“M” vs. “S”, “S Mev” or “S FPP”, respectively). d GGPP blocks the retainment effect in a concentration-dependent fashion. Experimental design as in Fig. 2b, except the use of 5, 10, 20 or 40 µM geranylgeranyl pyrophosphate (GGPP; Echelon). Five additional experiments with similar results were performed. Data analysis and color code as in Fig. 1c (“M” vs. “S” or “S GGPP”, respectively). All comparisons of “S” vs. “S GGPP” were <0.001. e GGPP interferes with Mac but not with Mo. Mo and Mac (50,000/cm2; 24-well plate) were prepared and incubated as described in Fig. 1a. Statin and GGPP were added on day 1 to Mo and Mac. To Mo LPS was also added on day 1 and the cells were incubated for 24 h. To Mac LPS was added only on day 2 and the cells were then incubated for further 24 h. Color code and statistics (No GGPP vs. With GGPP) as described in Fig. 1c. N, no statin; S, statin (20 µg/ml); C, no GGPP; G, GGPP (5 µM). f Like statin, GGTI, but not FTI or Zara, retains the cytokine production of Mac. Mac (100,000 cells/cm2; 24-well plate) were prepared in the presence of medium (M) or medium containing fluvastatin (S), geranylgeranyl transferase inhibitor 298 (GGTI; 8 µM), farnesyl transferase inhibitor 277 (FTI; 8 µM) or the cholesterol synthesis inhibitor zaragozic acid A (Zara; 20 µM; Sigma-Aldrich), respectively, for 24 h. On day 2 LPS was added, supernatants were harvested on day 3 and cytokines were measured in ELISA. Two experiments with similar results were performed. Data analysis and color code as in Fig. 1c (“M” vs. “S”, “GGTI”, “FTI” or “Zara”, respectively). Please note the axis break.

