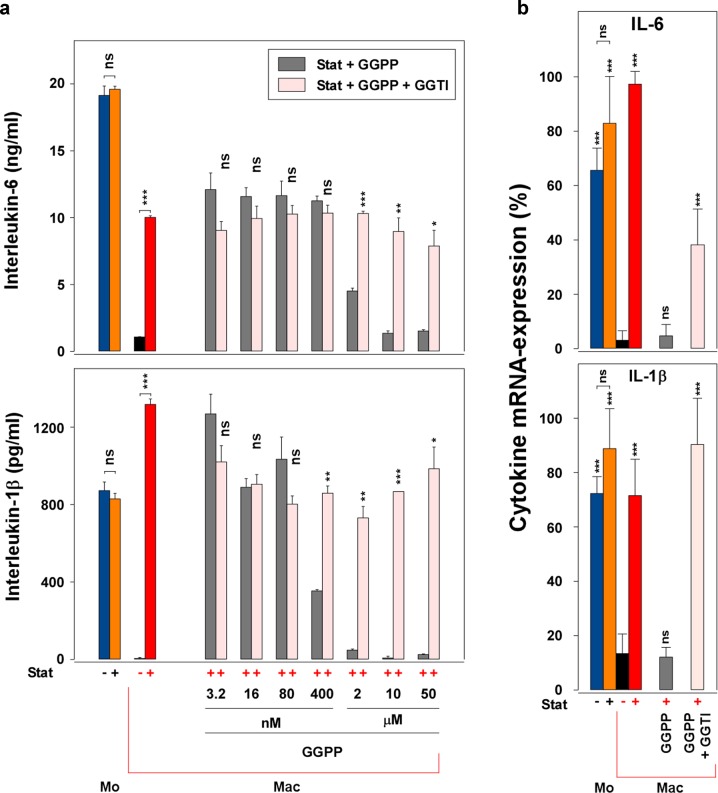
Fig. 3. The blockade of the statin-mediated retainment effect by GGPP is reversed by GGTI.
a GGTI reverses the GGPP effect. Monocytes and macrophages (50,000 cells/cm2; 24-well plate) were cultured and stimulated as described in Fig. 1a. The cytokine production of the four controls is presented in the left part of the figure. To parallel cultures of the statin-treated Mac (red column), GGPP at various concentrations, in the absence (gray columns) or presence (rose columns) of GGTI (8 µM), was added on day 1. To all macrophage cultures, LPS was added on day 2 and the supernatants were harvested 24 h later. The cytokine levels were measured in ELISA. One additional experiment with similar results was performed. Data analysis (“Stat + GGPP” vs. “Stat + GGPP + GGTI”; other comparisons are indicated by the lines) and color code (except rose and gray, compare above) as in Fig. 1c. b The blockade of the retainment by GGPP and its reversal by GGTI is also detectable at the RNA-level. Monocytes and macrophages were prepared as described in Fig. 3a in 25 cm2 culture flasks (Falcon, Corning GmbH, Kaiserslautern, Germany; 100,000 cells/cm2; Stat, 10 µg/ml; GGPP, 5 µM; GGTI, 8 µM). IL-1 and IL-6-RNA was measured using the “iScript protocol”. Cytokine levels were normalized to GAPDH. The highest normalized value of each experiment was determined 100% and the mean ± SD of three experiments calculated. Data analysis was performed in SPSS (ANOVA and LSD post hoc; “Mac” vs. “Mo”, “Mo + Stat”, “Mac + Stat”, “Mac + Stat + GGPP” or “Mac + Stat + GGPP + GGTI”, respectively; other comparisons are indicated by the lines; compare Fig. 1c). Color code as in Fig. 3a.

