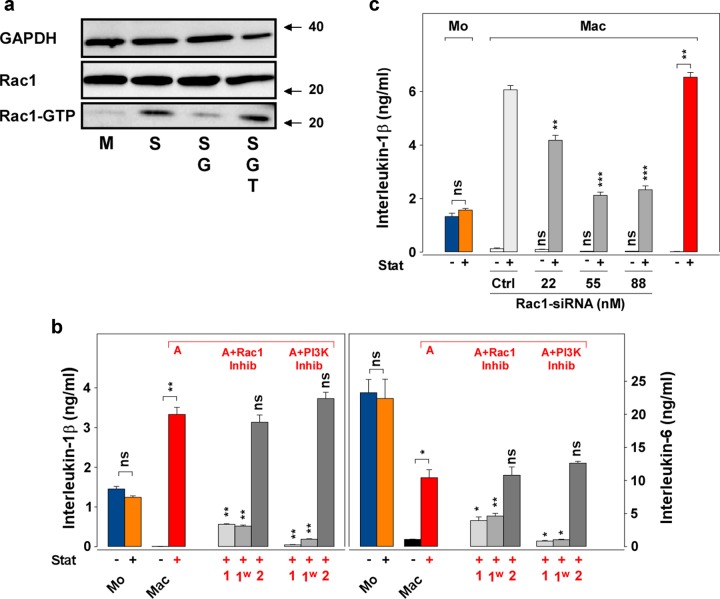
Fig. 4. Rac1 is involved in the retainment of the cytokine production.
a Statin-pretreated Mac (“low-GGPP Mac”) express enhanced Rac1-activation. Macrophages (100,000/cm2) were prepared by incubation (75 cm2 culture flask; 24 h) in the absence (M) or presence of statin (S; 10 µg/ml), statin and GGPP (SG; G, 5 µM) or statin, GGPP, and GGTI (SGT; T, 8 µM). The cells were harvested and lysed in pull-down lysis buffer. Pull-down for Rac1-GTP was performed with PAK-PBD beads, the beads were washed and used in Western blot. Control samples for GAPDH and total Rac1 (Rac1) were directly taken from the lysate and applied to the Western blot. The numbers at the right indicate the molecular weight (kDa) taken from a molecular weight standard. Four additional experiments with similar results were performed. b Rac1- and PI3K-inhibitors block the retainment effect during the differentiation phase. Monocytes and macrophages (50,000 cells/cm2; 24-well plate) were incubated as described in Fig. 1a. Parallel to macrophages treated with statin (A; red letter above the columns), macrophages were treated with statin and a Rac1/TIAM1-inhibitor (A + Rac1 Inhib; NSC23766, Tocris, Bio-Techne GmbH, Wiesbaden, Germany) or a PI3K-inhibitor (A + PI3K Inhib; LY294002, Tocris), respectively, both at 10 µM, under the following protocols: “1”, statin and inhibitors were present during day 1 and 2; “1w”, statin and inhibitors were present during day 1 and removed by washing on day 2; “2”, statin was added on day 1 and the inhibitors were added on day 2. To all macrophage cultures LPS was added on day 2. IL-1 and IL-6 were measured in ELISA. One additional experiment with similar results was performed. Data analysis (“Mac + Stat” vs. “Mac + Stat + Inhibitors”; other comparisons are indicated by the lines) and color code as in Fig. 1c. c Rac1-siRNA blocks the retainment in macrophages. Monocytes and macrophages were cultured as described in Fig. 1a in 6-well plates (100,000 cells/cm2; 100 ng/ml LPS), in the absence or presence of statin (10 µg/ml). The control siRNA (Ctrl; 88 nM) or the Rac1-siRNA (both are presented as gray columns; both are “Silencer®select” siRNAs, Ambion) were also added on day 1 in the depicted concentrations to the Mac. LPS was added on day 2 to all Mac and the supernatants were harvested on day 3. IL-1 was measured in ELISA. Two experiments with similar results were performed. Data analysis (“Ctrl” vs. “Rac1-siRNA”) and color code as in Fig. 1c.

