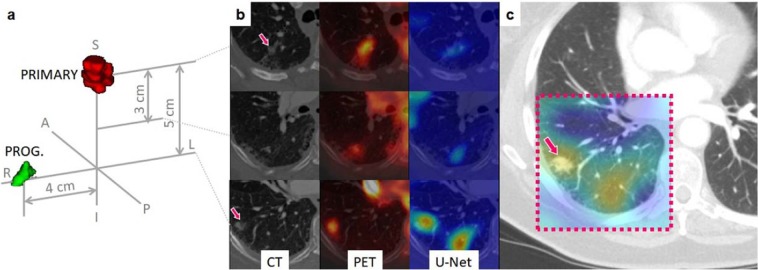
Figure 6.
Correlation between U-Net visualization and cancer progression. Post-SBRT CT images were compared with the U-Net visualization results. We observed an agreement of the heated regions with the actual location of recurrence as in this example. (a) A 3D rendering showing the location of the primary tumor volume (red) and the progression region (green) of the case IA001765; (b) Pre-SBRT transversal slices at the primary tumor location (top), 3 centimeters below (middle row), and 5 centimeters below (inferior row); (c) A follow up (post-SBRT) image of the same patient. The dashed box indicates the estimated corresponding ROI to the primary (pre-SBRT) CT slices. The heat map generated based on pre-SBRT, i.e., the same heat map as in the bottom row of (b), is superimposed on top of the ROI on the post-SBRT image. Notice that the recurrence location coincides with the heated area.

