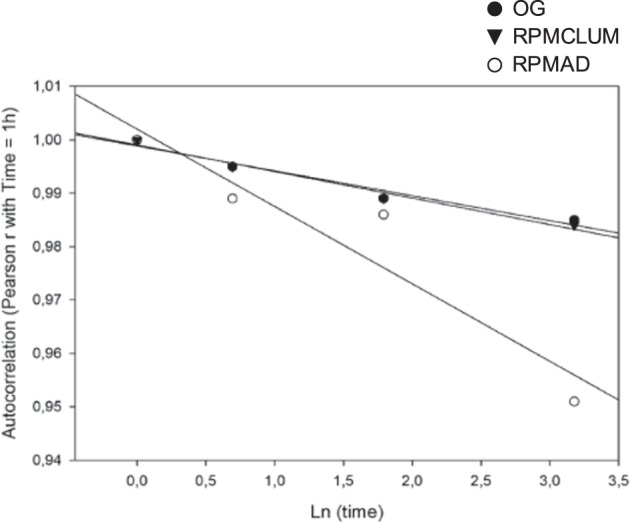
Fig. 5.

Autocorrelation time course of each cell population. The time course of the three OG, RPMAD, and RPCLUM conditions are reported in the figure in a plot having as abscissa the natural logarithm of time and as ordinate the autocorrelation with initial state relative to each condition. All the three conditions show a slight decrease (albeit highly significant, p < 0.001) in their autocorrelation along time, but the identity with the initial state remains very high (r > 0.95), consistently with the character of (quasi)-stable state of both RPM and On Ground samples.
