
Fig. 6.
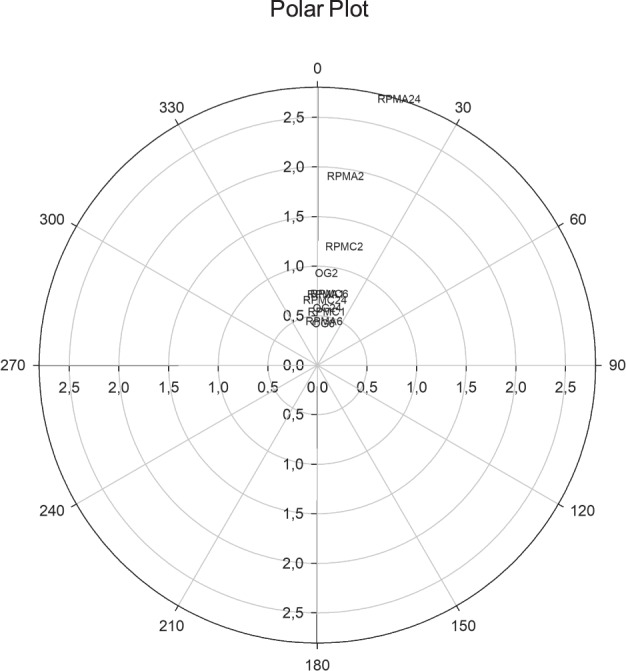
Euclidean and Angular distances in gene-expression patterns. The plot reports the Euclidean distance (see also Supplementary Fig. 3) from the centre computed over the gene-expression values (concentric circles) and the angle of deviation (the angle between OG1 and different profiles having Pearson r with OG1 as cosine) from baseline (OG1) condition. Data are computed at different times for both RMPCLUM and RPMAD (1, 2, 6, 24 h). The overlapping or partially overlapping experimental points are the following: OG6, OG24, RPMA1, RPMA6, RPMC1, RPMC6, RPMC24.