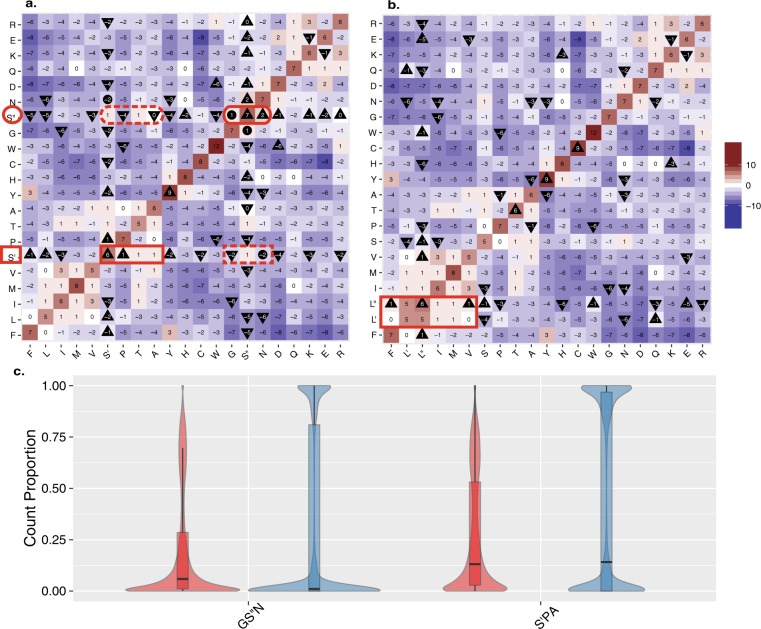
Figure 2.
Comparison of codon and amino acid substitutions in the alignment database of 99 vertebrates species. (a) BLOSUM heat map from the UCSC alignments generated while considering substitutions to/from S′ and S′′ separately. Heat map colored from blue (<−10) to red (>10) with a midpoint gradient of white (0). A triangle pointing up designates an increase in value compared to the unmanipulated UCSC based BLOSUM (Sup. Fig. 1), while a triangle pointing down represents a decrease in value. A circle signifies a sign flip (+to - or vice versa) compared to the unmanipulated BLOSUM (Sup. Fig. 1). Note that the viable/positive substitutions from S′′ (red oval) are all negative from S′ (red rectangle broken line), similarly viable/positive substitutions from S′ (red rectangle) are not from S′′(red oval broken line). T, which is equally reachable from both S′ and S″ remains unchanged. (b) The BLOSUM generated by considering substitutions to/from L′ and L′′ separately (details as in a). Note how no positive substitutions from L′ or L′′ are negative from the other and all negative substitutions are shared (positive marked in red rectangle). (c) Considering only those positions where serine is meaningfully present (see Methods), we show the fraction of species sequence positions that are GS′′N (two plots on the left) or S′PA (two plots on the right). For each set of amino acids, the species sequence positions are split by the measure of diversity into positions above the upper quartile of diversity (red) and below the lower quartile of diversity (blue). Each distribution is represented by a box plot overlaying a violin plot. The black line represents the median value of each group.

